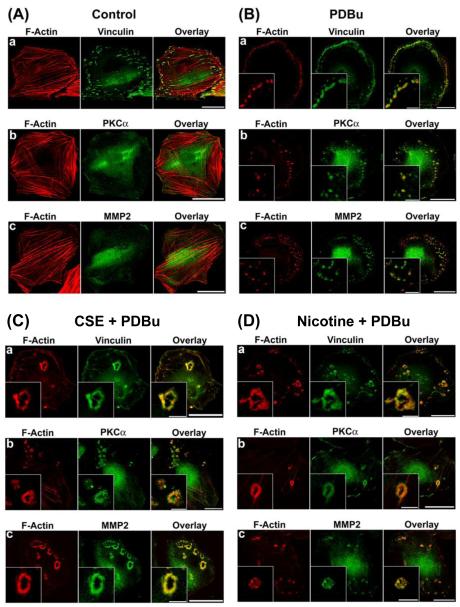
Figure 1.
Cigarette smoke extract (CSE) and nicotine-treated A7r5 cells formed podosome rosettes in response to PKC activation by phorbol-12,13-dibutyrate (PDBu). This figure shows confocal microscopic images of: a) F-actin and vinculin, b) F-actin and PKC-α, and c) F-actin and MMP-2 in: A) unstimulated untreated (control), B) PDBu-stimulated, untreated, C) PDBu-stimulated, CSE-treated, and D) PDBu-stimulated, nicotine-treated A7r5 cells. CSE treatment consisted of treating cells with 5% CSE for 6 hr prior to stimulation by 1 μM PDBu for 1 hr. Nicotine treatment consisted of treating cells with 2 μM nicotine for 6 hr prior to stimulation by 1 μM PDBu for 1 hr. F-actin was labeled in red. Vinculin, PKC-α, and MMP-2 were labeled in green. Insets in panels B and D represent higher magnification of selected regions of the cell to show the structure of podosomes and podosome rosettes. Horizontal bars in main panels represent 40 μm, whereas horizontal bars in insets represent 8 μm.

