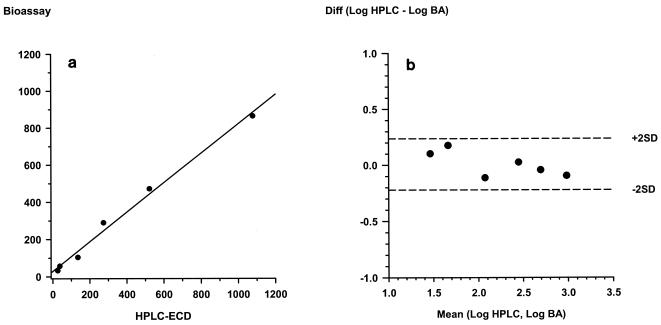
FIG. 3.
Comparison of results for plasma samples spiked with various concentrations (n = 6) of artesunate determined by the bioassay and HPLC-ECD. The results of the two methods showed excellent correlations and agreement. (a) Scatterplot of bioassay versus HPLC-ECD (r2 = 0.992); (b) Bland-Altman plot of the difference (Diff) in log values determined by bioassay (BA) and HPLC-ECD versus the mean values (mean difference = 0.008; limits of the agreement = −0.221 and 0.236, respectively).

