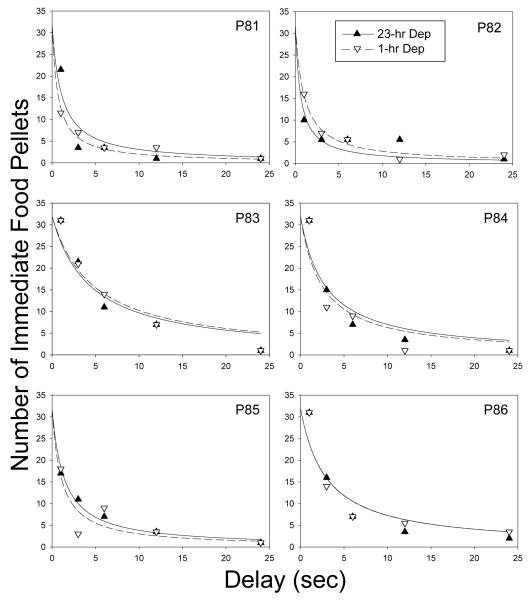
Figure 3.
Number of immediate food pellets at indifference (i.e., the subjective value of the 32-pellet reinforcer) plotted as a function of delay for all pigeons in Experiment 2. The curves represent the best-fitting hyperboloid discounting function (Eq.1) with s = 1.0 (i.e., a simple hyperbola), for all pigeons.

