
Figure 5.
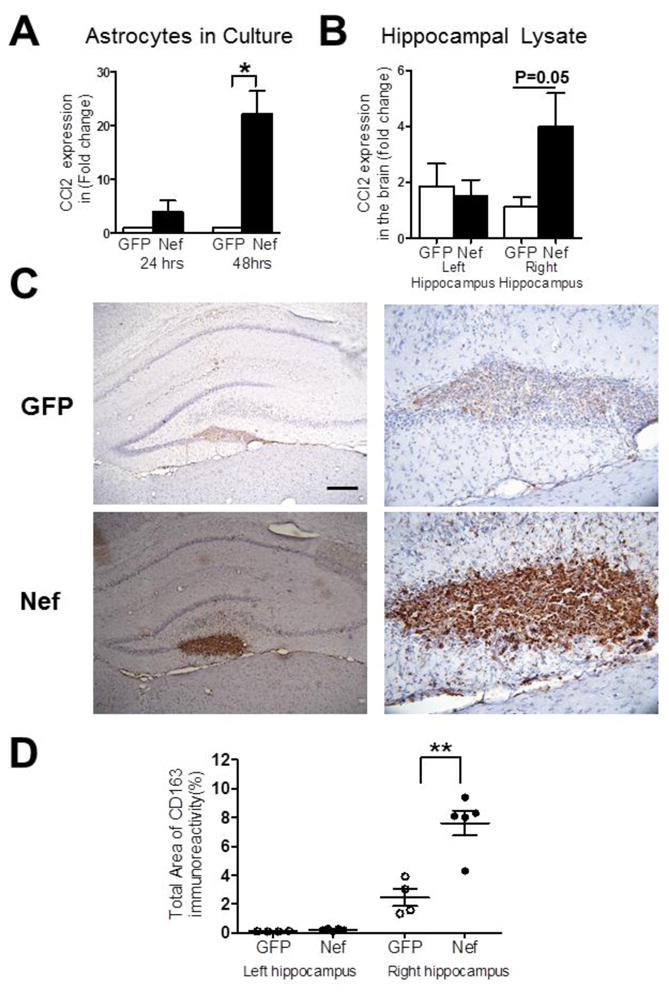
The Nef group shows CCL2 induction and enhanced infiltration of CD163-positive macrophages proximal to injection site compared to GFP controls. Real time, quantitative RT-PCR was used to measure CCL2 expression in: (A) cultures of transfected primary astrocytes expressing GFP (open bars) or Nef (closed bars) or (B) hippocampal tissue implanted with GFP-expressing (open bars) or Nef-expressing (closed bars) astrocytes. Data are presented for both non-infused (left) and infused (right) hemispheres. (C) Representative tissue sections immunostained for macrophage infiltration using the CD163 marker, GFP group (top) and Nef group (bottom) at 100x (left) and 400x (right) magnification. (D) Densitometric analysis was used to quantify CD163 staining. Scatter plot shows mean (+/− standard error) for the GFP (open circles) and Nef closed circles) groups. Scale bar = 100μM. *p<0.05; **p<0.005.