Figure 1.
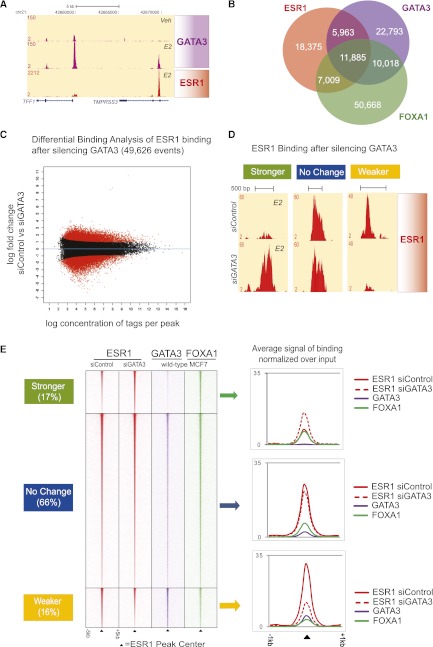
Silencing of GATA3 results in redistribution of ESR1 binding globally. (A) GATA3 binding at the TFF1 locus in unstimulated and E2-treated MCF7 cells. (B) Venn diagram showing overlap in ESR1, FOXA1, and GATA3 binding in MCF7 cells. (C) MA plot of Differential Binding Affinity (DBA). Analysis using edgeR of ESR1 binding in siControl versus siGATA3 conditions of three biological replicates. The universe of ESR1-binding events consists of 49,626 peaks, which were used in the DBA analysis. The x-axis shows the log concentration of sequenced tags per peak. The y-axis represents the log fold change of siControl over siGATA3. A third of all ESR1-binding events showed significant changes in affinity at FDR < 0.1. The binding events plotted red above 0 on the y-axis represent Weaker ESR1 binding in siGATA3 (16%), whereas the red at the bottom represents events with Stronger ESR1 affinity in siGATA3 (17%). (D) A representative example of the redistributed ESR1 binding in siGATA3 MCF7 cells. (E, left) Heatmaps of the ChIP-seq data sets centered on the ESR1 peaks and their averaged signal intensity (right) show that the Weaker ESR1 events are cobound by GATA3, suggesting that at these regions GATA3 mediates ESR1–chromatin associations. However, GATA3 binding did not overlap at regions where ESR1 binding was gained following silencing of GATA3.

