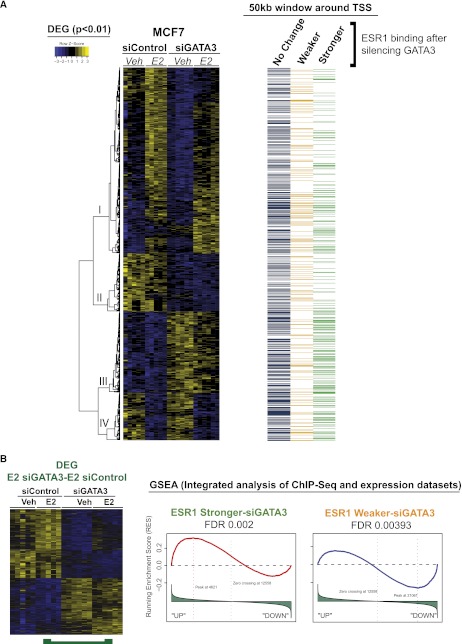
Figure 4.
MCF7 cells depleted of GATA3 have an altered E2 transcriptional program that correlates with the redistributed ESR1 binding. (A) Integration of the Differentially Expressed Genes (DEG) with the redistributed ESR1 ChIP-seq data sets. A 50-kb window around the transcription start sites (TSS) of all DEG targets was overlapped with the altered ESR1 binding in siGATA3 conditions. ESR1 stronger binding is enriched near genes that are overexpressed in siGATA3 compared with siControl (bottom of gene cluster I, cluster III, and cluster IV). ESR1 Weaker events are in the vicinity of genes down-regulated by siGATA3 (Gene clusters 1 and II). Also included (right) is information showing whether each gene has an ESR1-binding event within 50 kb of the TSS. Included is ESR1 binding that is gained (green), lost (yellow), or not changed (blue) following GATA3 silencing. (B) Gene Set Analysis Enrichment (GSEA) reveals that ESR1 Stronger events after GATA3 silencing are enriched near up-regulated genes, whereas ESR1–Weaker siGATA3-binding events correlate with transcriptional down-regulation in siGATA3-treated cells.

