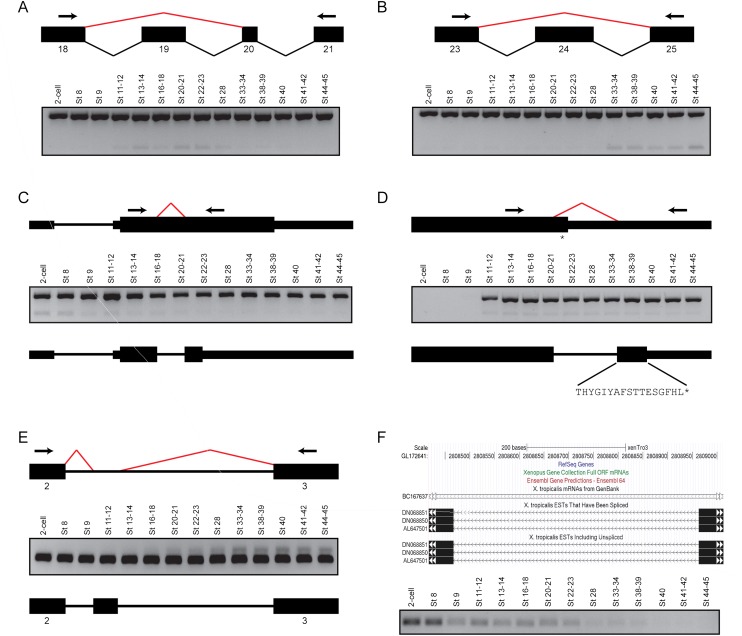
Figure 4.
Most of the novel splice junctions supported by at least two nonredundant reads can be validated by reverse transcription PCR. (A) Skipping of exon 19 in the fibronectin gene, fn1. (Upper panel) A schematic of the splicing events between exons 18 and 21 inclusive. Black boxes indicate the individual exons, while the bent lines indicate the splicing events (black, annotated; red, novel). (Arrows) Primers used for PCR. (Lower panel) Gel image of the PCR, showing two products. The upper stronger band is present in all stages and represents the annotated isoform, while the lower band represents the exon skipping event and shows a peak expression between Stages 20 and 23. (B) Skipping of exon 24 in fn1. (Upper panel) A schematic of the splicing events between exons 23 and 25 inclusive. (Arrows) PCR primers. (Lower panel) Gel image showing the results of the PCR. The upper stronger band is present in all stages and corresponds to the annotated isoform, while the lower band represents the exon skipping event. Interestingly, the product lacking exon 24 is only clearly expressed from Stage 33 onward. (C) Splicing of a facultative intron in the metabolic gene, hpdl. (Upper panel) A schematic of the gene structure of hpdl. The arrows indicate the PCR primers, while the red bent line indicates a novel splicing event detected within the coding exon of the gene. (Middle panel) Gel image showing the PCR results. The upper stronger bands represent the annotated gene product, while the lower weaker bands correspond to the novel transcript, which is present in the beginning stages of development. (Lower panel) A schematic showing that the novel splice junction creates a premature STOP codon. (D) Intron retention in the gata3 transcription factor. (Upper panel) A schematic showing the location of the novel splice junction (red bent line) and the location of the PCR primers (arrows). The newly detected splicing event removes the annotated STOP codon (asterisk). (Middle panel) Gel image of the PCR results. Both the annotated isoform (upper stronger bands) and the novel isoform (lower weaker bands) are not expressed from the two-cell stage to Stage 9 inclusive. (Lower panel) A schematic showing that the novel splice junction extends the C-terminus of the protein by 17 amino acids. (E) Extra exon in the myosin gene, myl6. (Upper panel) A schematic showing novel splicing events (red bent lines) between exons 2 and 3. (Middle panel) Gel image of the PCR results. Although the annotated isoform is strongly expressed in all the stages tested, the novel isoform containing the additional exon is only expressed after neurulation. (Lower panel) A schematic showing the location of the newly discovered exon in myl6. (F) A novel intergenic transcript between tmtc2 and slc6a15. (Upper panel) A snapshot of the UCSC Genome Browser showing the genomic locus of a splicing event detected between GL172641: 2808467 and GL172641: 2808964. Several ESTs support the detected splicing event. (Lower panel) Gel image showing the results of a PCR using primers flanking the novel splice junction. The expression of the corresponding transcript is highest at the two-cell stage and Stage 8 and it then decreases over development.

