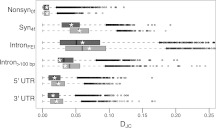
Figure 5.
Boxplot distribution of lineage-specific divergence by gene across different site classes in autosomal (2 + 3) genes in D. simulans and D. melanogaster. For each site class, the top darker bar represents the distribution across D. simulans, and the bottom lighter bar for D. melanogaster (each gene must contain a minimum of 10 non-N sites for intronFEI sites and 100 otherwise). (*) The weighted average (based on the number of sites corresponding to the annotated class for each gene) across all genes. See also Table 2.

