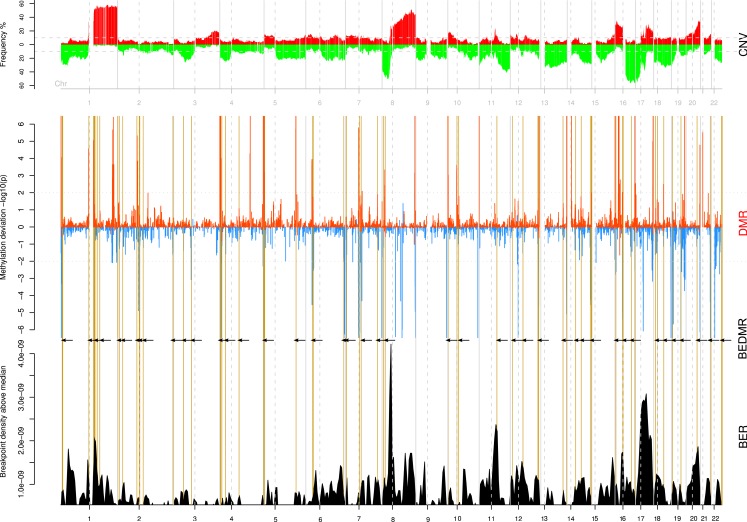
Figure 2.
Significant DMRs tend to co-localize with breakpoints enriched regions. The copy number profile of all 108 breast tumors is shown on the top track (CNV). The middle track (DMR) shows the amplitude of the DNA methylation level change compared to normal across genome. Hypo-methylated regions are assigned a negative score, defined as log10(p) while hyper-methylated regions take a score equal to −log(p). Significant DMRs are marked by peaks with a score greater than ±2. The bottom track (BER) shows the locations of breakpoint enriched regions. Breakpoint enriched DMRs (BEDMR), i.e., DMRs occurring in the vicinity of a BER are marked by vertical yellow lines and black arrows.

