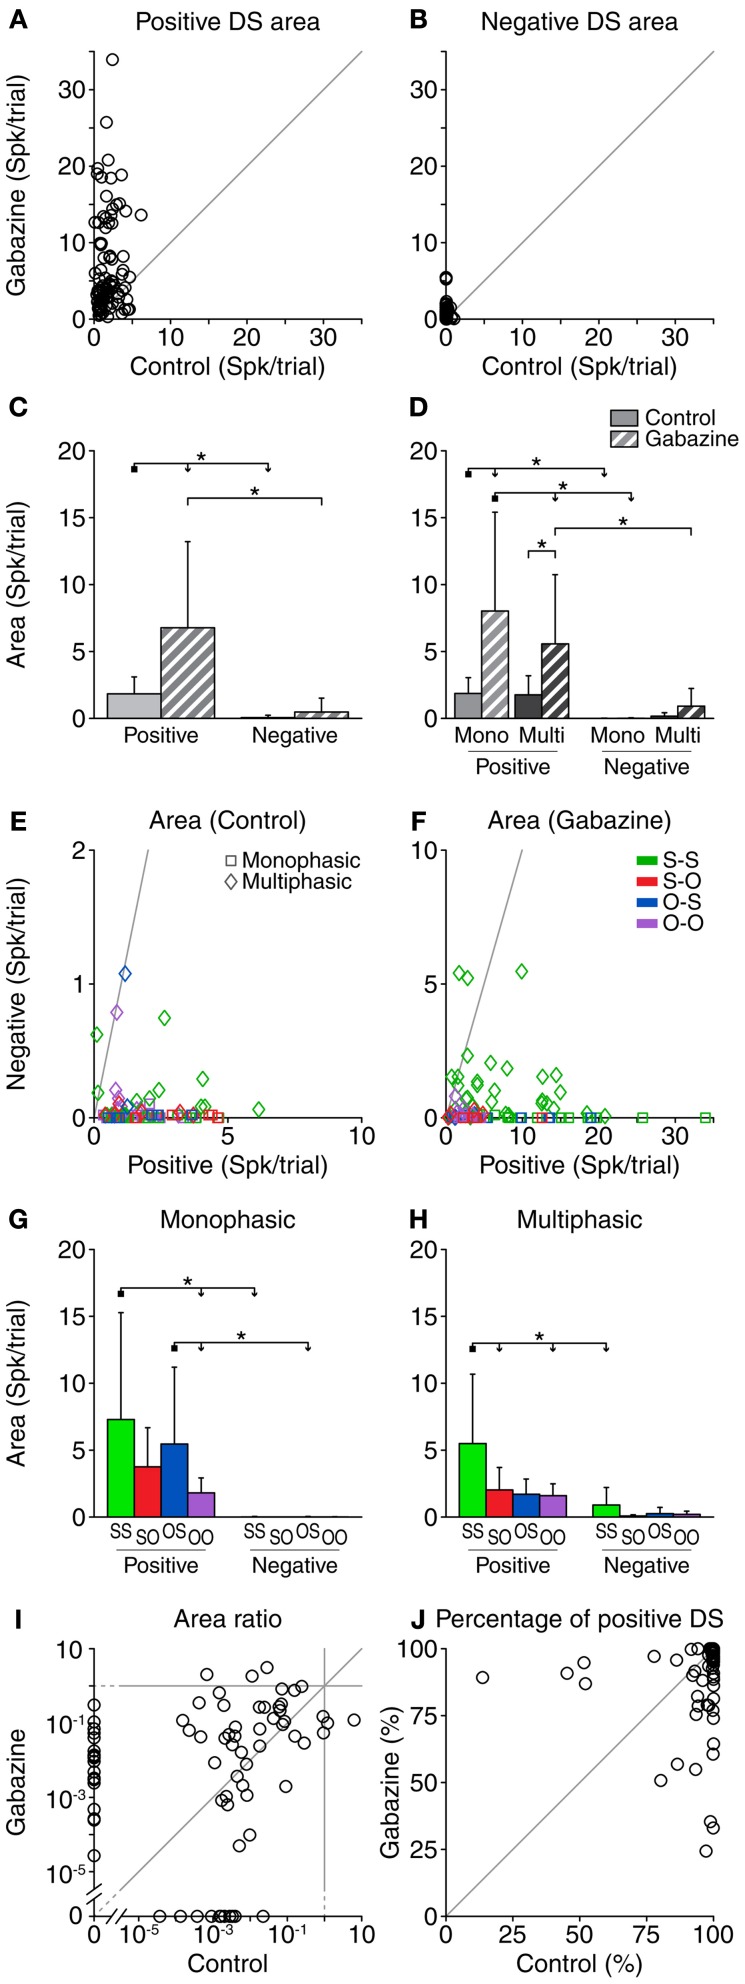
Figure 4.
Area (accumulated response) of the DS for each neuron, corrected for the baseline DS. The area of both the positive (A) and negative (B) portions of the DS increased during the gabazine condition. (C) Mean and standard deviation of the area for all the cases pooled together, in the control (solid fill) and gabazine (pattern fill) conditions. (D) Mean and standard deviation of the area, grouped by DS type. The area of the positive portions of the DS was larger than that of the negative ones for most neurons, both in the control (E) and the gabazine (F) conditions. The axes in these panels have been plotted at different scales for a better visualization of the data. (G) Mean and standard deviation of the different firing pattern groups for the monophasic or (H) multiphasic units, including units in both the control and gabazine conditions. The area ratio (negative area/positive area) (I) and the percentage of positive area (J) for each individual DS show that, while the amount of positive and negative DS portions changed during the gabazine condition, there was no clear trend. Mono, monophasic; Multi, multiphasic. S-S, standard and deviant sustained; S-O, standard sustained and deviant onset; O-S, standard onset and deviant sustained; O-O, standard and deviant onset. Asterisks indicate p < 0.05.

