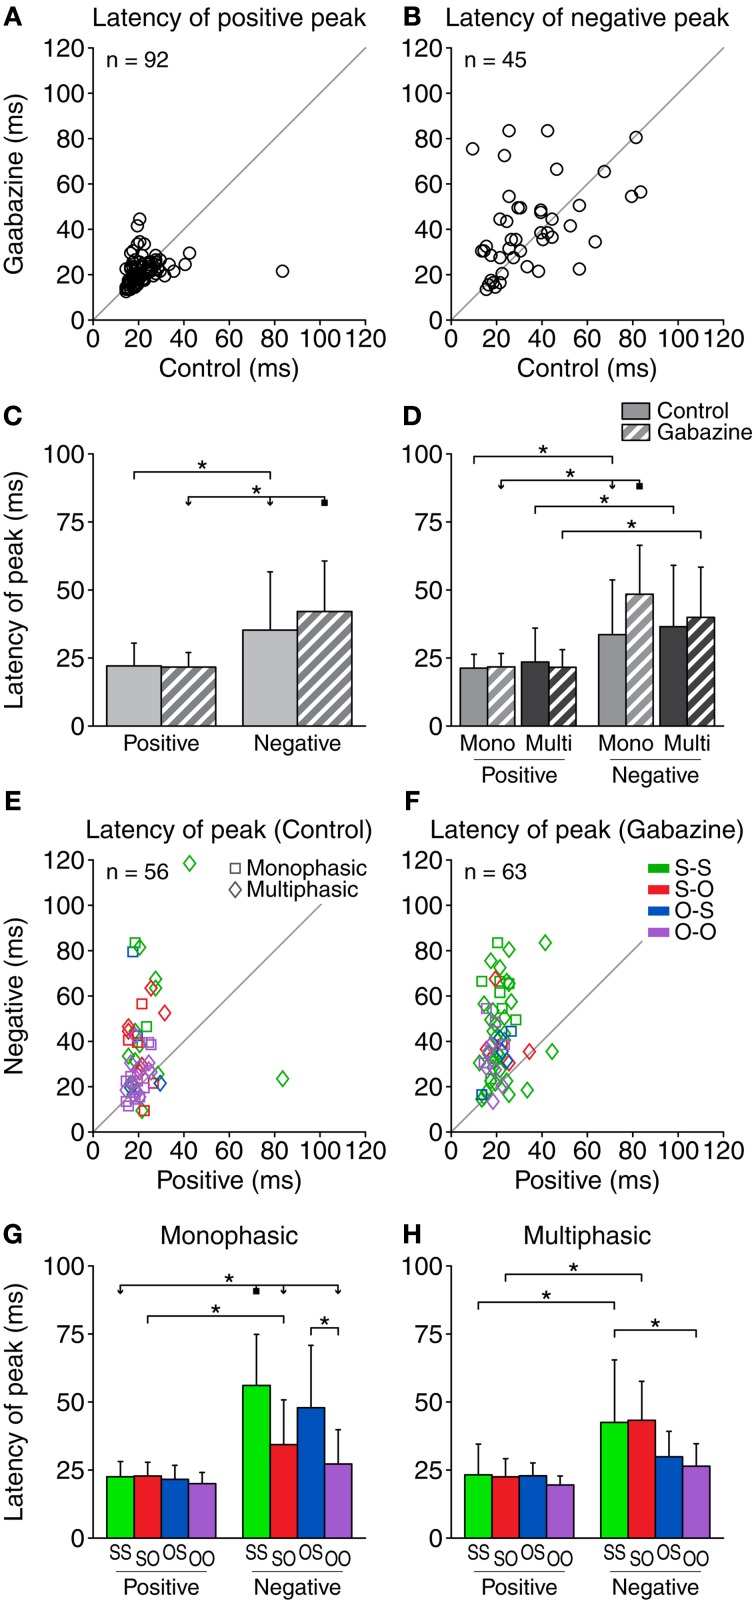
Figure 6.
The latency of the positive DS peak was relatively short (10–40 ms) and was little affected by gabazine (A), while the latency of the negative peak extended over a longer range of values (B). Some of the cases did not contain a negative part of the DS, so the corresponding latencies could not be calculated. The number of cases plotted is indicated inside each panel. (C) Mean and standard deviation of the latency of the peaks for all the cases pooled together, in the control (solid fill) and gabazine (pattern fill) conditions. (D) Mean and standard deviation of the latency of the peaks, grouped by DS type. In both the control (E) and the gabazine (F) condition, the latency of the positive DS peak was shorter than the latency of the negative peak for most neurons. (G) Mean and standard deviation of the different firing pattern groups for the monophasic or (H) multiphasic units, including units in both the control and gabazine conditions. Mono, monophasic; Multi, multiphasic. S-S, standard and deviant sustained; S-O, standard sustained and deviant onset; O-S, standard onset and deviant sustained; O-O, standard and deviant onset. Asterisks indicate p < 0.05.

