Fig. 7.
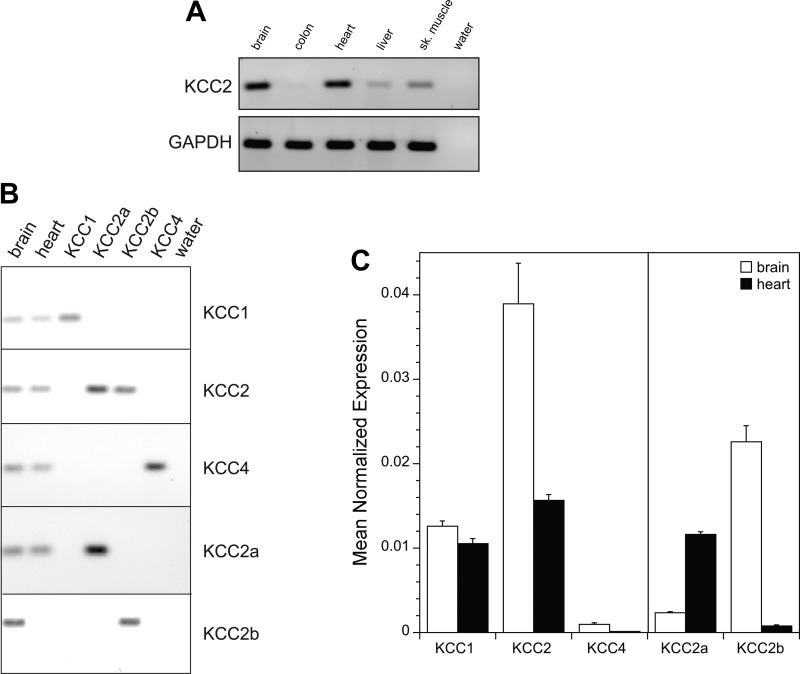
KCC2 mRNA expression in chicken tissues. A: RT-PCR of KCC2 in chicken tissues. B: RT-PCR demonstrating the specificity and single amplicon production of each primer set for KCC1, KCC2, KCC4, KCC2a, and KCC2b. C: semiquantitative real-time PCR analysis of KCC1, KCC2, KCC4, KCC2a, and KCC2b in chicken brain and chicken heart. Mean normalized expression level of each transcript was determined using the equation: (Eref)Ct−ref/(Etarget)Ct−target with GAPDH used as reference and where Ct = crossing threshold (see materials and methods). Values are means ± SE of 8 runs from four separate RNA extractions (2 animals). Brain and heart means are statistically different for each isoform or splice variant tested (P < 0.05 using two sample t-test).

