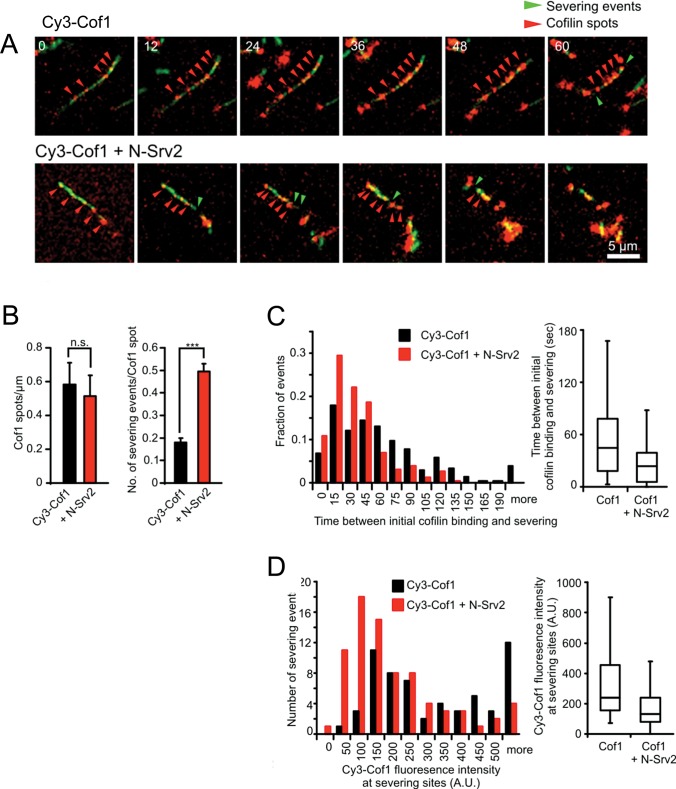
FIGURE 3:
Dual-color TIRF microscopy analysis of actin filament severing by Cy3-Cof1 and N-Srv2. (A) Filament severing by Cy3-Cof1 ± N-Srv2 (time in seconds). Filaments were assembled as in Figure 2A, then reaction mixtures were replaced with 10 nM Cy3-Cof1 ± 100 nM N-Srv2. Red arrowheads mark accumulations of Cy3-Cof1. Green arrowheads mark severing events. (B) Number of Cy3-Cof1-spots per micrometer of F-actin (left) and number of severing events per Cy3-Cof1-spot (right) in the presence of 10 nM Cy3-Cof1 (n = 229, black bars) and 10 nM Cy3-Cof1 + 100 nM N-Srv2 (n = 188, red bars). Error bars represent SD from three experiments. n.s., not significant; ***, p < 0.001 as determined by t test. (C) Distribution of time intervals between initial detection of Cy3-Cof1 on a filament and severing at that location, in the presence and absence of N-Srv2, determined from experiments as in (A). (C) Distribution of Cy3-Cof1 fluorescence intensity on filaments one frame prior to severing events. Determined from experiments as in (A). Boxes in box plots shown in (C) and (D) indicate 25th percentile, median, and 75th percentile of all values; error bars indicate 10th and 90th percentiles.

