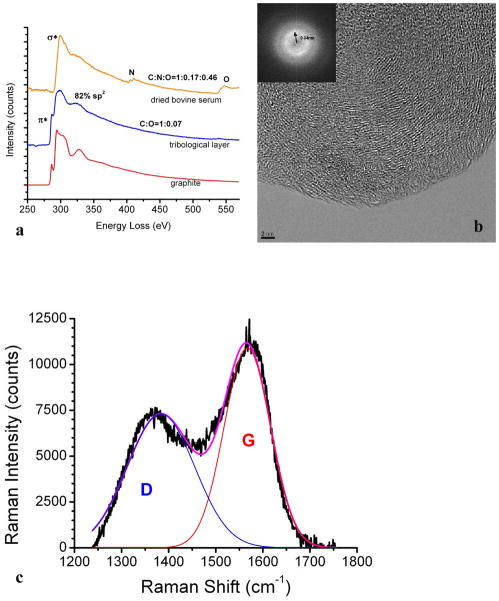
Figure 9.
(a) The EELS spectrum of tribological layer, dried bovine serum and graphite. The π*peak is present in the tribological layer. (b) HREM and the corresponding power spectrum show short-range ordered graphitic carbon layers. (c) Raman spectrum of tribological layer on a retrieved CoCrMo hip implant. G (red) and D (blue) lines are clearly present. (from 60)

