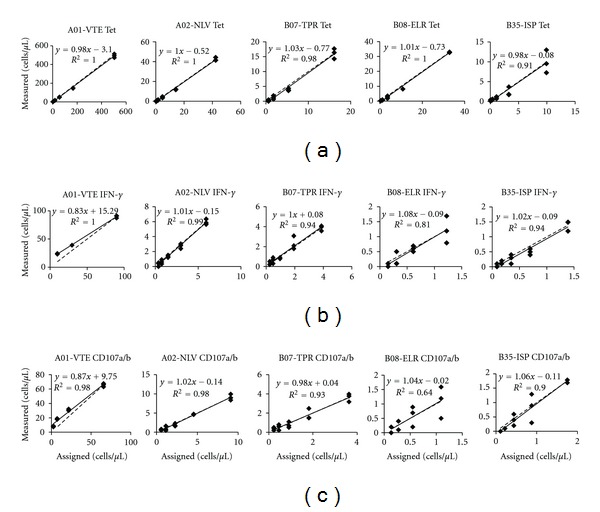
Figure 1.

Linearity of tetramer staining and peptide-stimulation assays. Panel A shows the scatter plots of tetramer staining with five allele-specific tetramer reagents. Panel B represents data for peptide-stimulation assay that measures INF-γ production. Panel C corresponds to CD107a/b expression after stimulation with allele-specific peptides.
