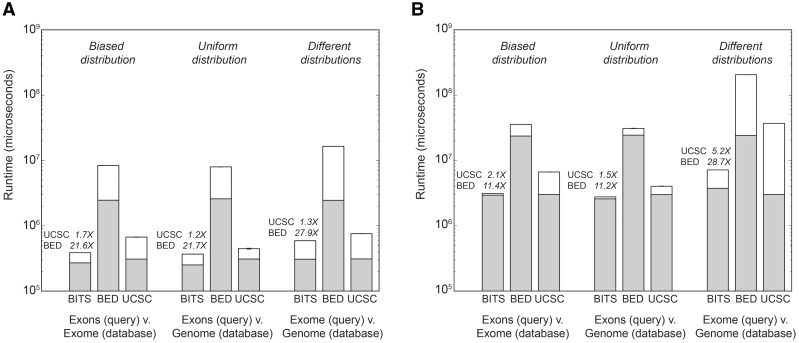
Fig. 2.
Run times for counting intersections with BITS, BEDTools and UCSC ‘Kent source’. (A) Run times for databases of 1 million alignment intervals from each interval distribution. (B) Run times for databases of 10 million alignment intervals from each interval distribution. Bars reflect the mean run time from five independent experiments, and error bars describe the standard deviation. Gray bars reflect the run time consumed by data structure construction, whereas white bars are the time spent counting intersections. Above each BITS execution time, we note the speed increase relative to BEDTools and ‘Kent source’, respectively. ‘Exons’ represents 400 351 RefSeq exons (autosomal and X, Y) for the human genome (build 37). BED = BEDTools; UCSC = ‘Kent source’

