. Author manuscript; available in PMC: 2013 Mar 7.
Published in final edited form as: J Med Chem. 2012 Feb 14;55(5):1978–1998. doi: 10.1021/jm201118h

Table 1.

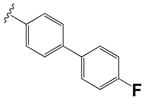
SAR around the side chain S-R2, sulfonamide moiety R1 of compound 1.

Compound ID S-R2 R1 IC50a (μM) Proteasome Activity (In Vitro)
CT-L T-L
1 (15a and 11a) S-CH2COOH graphic file with name nihms420508t1.jpg 3.0 ± 1.6 ND
15b graphic file with name nihms420508t2.jpg graphic file with name nihms420508t3.jpg 4.2 ± 2.1 ND
15c graphic file with name nihms420508t4.jpg graphic file with name nihms420508t5.jpg 4.2 ± 2.7 ND
24 graphic file with name nihms420508t6.jpg graphic file with name nihms420508t7.jpg 4.05 ± 2.64 ND
25 graphic file with name nihms420508t8.jpg graphic file with name nihms420508t9.jpg 0.28± 0.8 4.22 ± 0.30
26 graphic file with name nihms420508t10.jpg graphic file with name nihms420508t11.jpg 0.73 ± 0.03 2.35 ± 0.05
27 graphic file with name nihms420508t12.jpg graphic file with name nihms420508t13.jpg 0.18 ± 0.08 2.37 ± 0.05
28 graphic file with name nihms420508t14.jpg graphic file with name nihms420508t15.jpg 0.3 ± 0.07 7 ± 0.8
29 graphic file with name nihms420508t16.jpg graphic file with name nihms420508t17.jpg 0.150 ± 0.05 4.2 ± 1.8
30 graphic file with name nihms420508t18.jpg graphic file with name nihms420508t19.jpg 2.47 ± 0.52 7.2 ± 0.9
31 graphic file with name nihms420508t20.jpg graphic file with name nihms420508t21.jpg 1.97 ± 0.08 ND
32 graphic file with name nihms420508t22.jpg graphic file with name nihms420508t23.jpg 1.61 ± 0.06 ND
33 graphic file with name nihms420508t24.jpg graphic file with name nihms420508t25.jpg 0.30± 0.01 2.0 ± 0.2
34 graphic file with name nihms420508t26.jpg graphic file with name nihms420508t27.jpg 0.65 ± 0.09 ND
15d graphic file with name nihms420508t28.jpg graphic file with name nihms420508t29.jpg 0.51 ± 0.12 0.20 ± 0.10
15e graphic file with name nihms420508t30.jpg graphic file with name nihms420508t31.jpg 0.22 ± 0.06 4.80 ± 0.54
15f graphic file with name nihms420508t32.jpg graphic file with name nihms420508t33.jpg 0.23 ± 0.02 0.55 ± 0.32
15g graphic file with name nihms420508t34.jpg graphic file with name nihms420508t35.jpg 0.480 ± 0.09 1.55 ± 0.45
15h graphic file with name nihms420508t36.jpg graphic file with name nihms420508t37.jpg 0.23 ± 0.08 1.85 ± 0.67
15i graphic file with name nihms420508t38.jpg graphic file with name nihms420508t39.jpg 0.40 ± 0.12 2.80 ± 0.12
15j graphic file with name nihms420508t40.jpg graphic file with name nihms420508t41.jpg 0.23 ± 0.1 2.0 ± 0.60
15k graphic file with name nihms420508t42.jpg graphic file with name nihms420508t43.jpg 0.22 ± 0.01 1.3 ± 0.4
15l graphic file with name nihms420508t44.jpg graphic file with name nihms420508t45.jpg 0.40 ± 0.14 1.35 ± 0.56
15m graphic file with name nihms420508t46.jpg graphic file with name nihms420508t47.jpg 0.47 ± 0.18 1.45 ± 0.14
35 graphic file with name nihms420508t48.jpg graphic file with name nihms420508t49.jpg 0.570 ± 0.06 0.75 ± 0.13
36 graphic file with name nihms420508t50.jpg graphic file with name nihms420508t51.jpg 0.54 ± 0.08 0.57 ± 0.31
37 graphic file with name nihms420508t52.jpg graphic file with name nihms420508t53.jpg 0.6 ± 0.1 1.38 ± 0.60
38 graphic file with name nihms420508t54.jpg graphic file with name nihms420508t55.jpg 0.63 ± 0.1 1.10 ± 0.16
39 graphic file with name nihms420508t56.jpg graphic file with name nihms420508t57.jpg 0.88 ± 0.56 1.14 ± 0.16
a

Each IC50 is at least the mean of 3 determinations.

ND-IC50 not determined, these compounds showed less than 70% T-L inhibition at 10 μM.