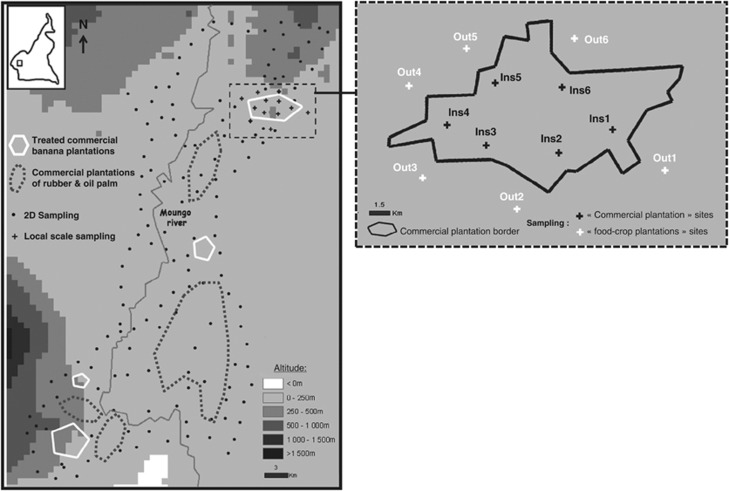
Figure 1.
Representation of the 50 × 80 km studied area localized in the Mungo area (region center of Cameroon) showing sampled sites. Left: distribution of the ‘2D' sampling sites (food-crop untreated plots) at a global scale (black dots) and of the sampling sites at the local scale of a single commercial plantation (black crosses). Right: enlargement of local scale sampling area.

