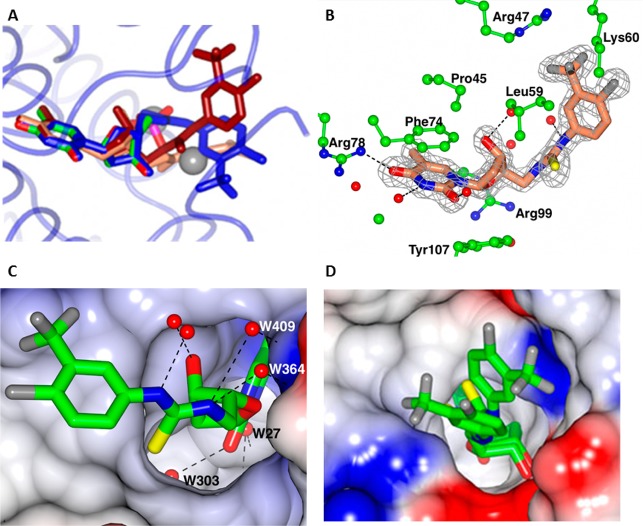
Figure 3.
(A) Superposition of three ligand complexes 53 (blue), 30 (coral) and 28 (tan) on the TMP–ADP complex (colored by atom type) determined previously (pdb: 1wwf). The chain was selected in which the ligand was best ordered. The two sodium atoms in the TMP–ADP complex are shown as spheres. The peptide backbone is shown for the 53 complex (pale blue). (B) The binding pocket for 28, showing interactions with the protein. (C) The binding pocket for 28. The surface of the protein is colored by electrostatic potential. The four waters that form H-bond bridges to the protein are numbered. (D) The two conformations for 53 in Chain C, the least well-ordered ligand site.

