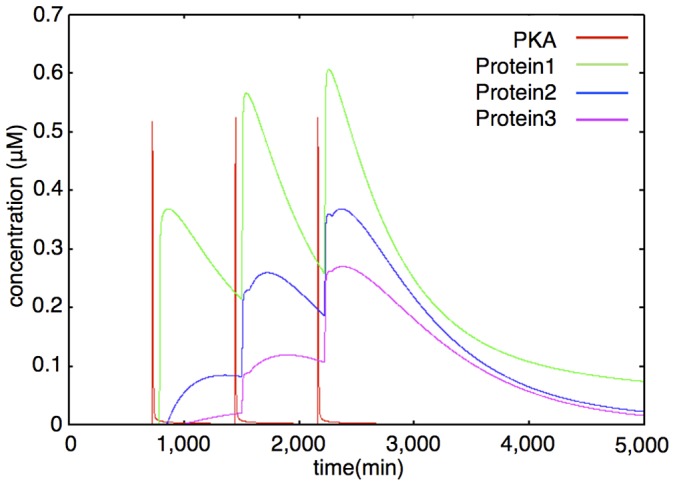
Figure 8. Example of dynamics of PKA, Proteins 1, 2, 3 (interval between stimuli = 720 min).

The colored lines show the time-course fluctuations of each of the components. Red: PKA; Green: Protein 1; Blue: Protein 2; Purple: Protein 3. External stimuli increase cAMP level (not shown) and cAMP increases the PKA level. PKA directly increases Protein 1 level. Protein 1 and PKA coordinately increase Protein 2. Protein 2 and PKA coordinately increase Protein 3. Protein generation is time-consuming, so there are time-lags between the PKA increase and protein increase.
