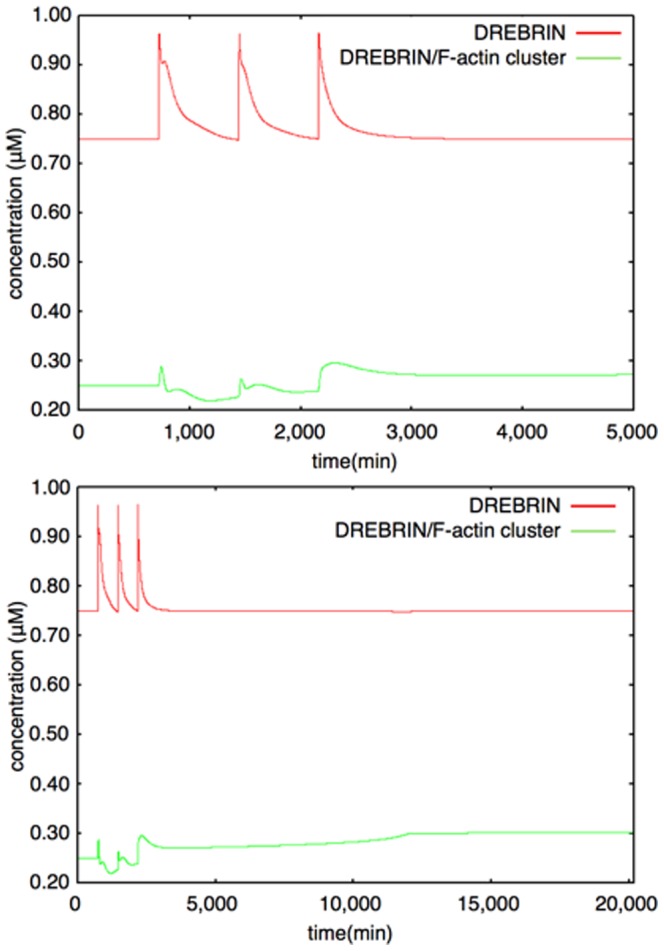
Figure 12. Example of dynamics of Drebrin (interval between stimuli = 720 min).

Upper Figure: 0–5000 min, Lower Figure: 0–20160 min (14 days) The colored lines show the time-course fluctuations of each of the components. Red: Drebrin; Green: Drebrin/F-actin cluster. External stimuli increase the Drebrin level. The Drebrin/F-actin cluster increases dependence on Drebrin and the Stable F-actin level. The equilibrium value of the Drebrin/F-actin cluster rises after the third stimulation because the Stable F-actin level increases at that time and once a large cluster is generated, a high equilibrium value is maintained in a self-feedback manner.
