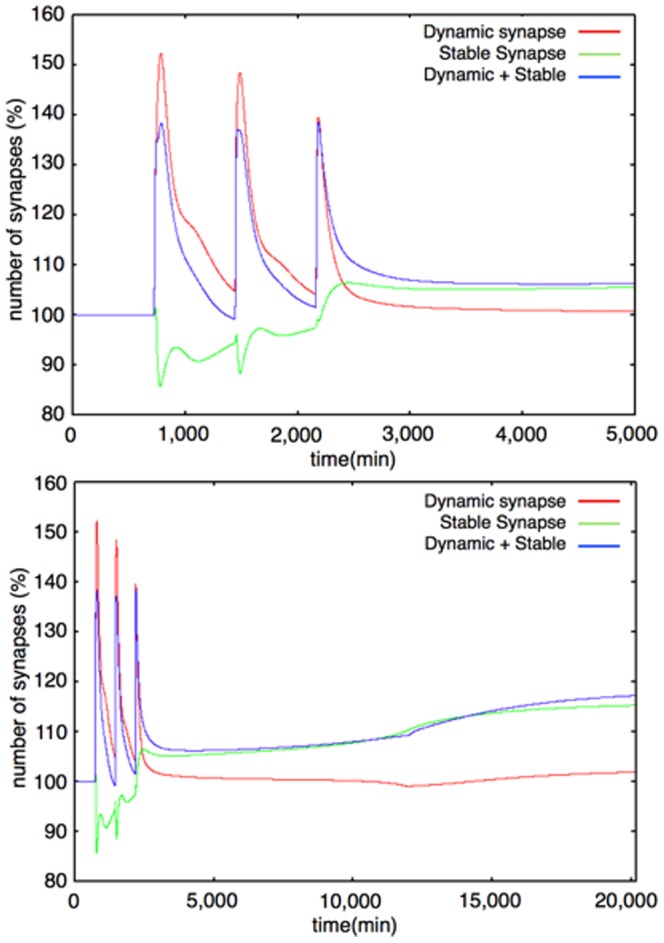
Figure 13. Example of dynamics of synapses (interval between stimuli = 720 min).

Upper Figure: 0–5000 min, Lower Figure: 0–20160 min (14 days) The colored lines show the time-course fluctuations of each of the components. Red: Dynamic Synapse; Green: Stable Synapse; Blue: Total Synapse (Dynamic+Stable). The Dynamic/Stable Synapse levels change according to the Dynamic/Stable F-actin levels. The time-course fluctuations of the synapses are similar to those of the Actin dynamics module. All the values in the graphs are normalized with the initial value of each variable, and indicate the relative values compared with the initial condition.
