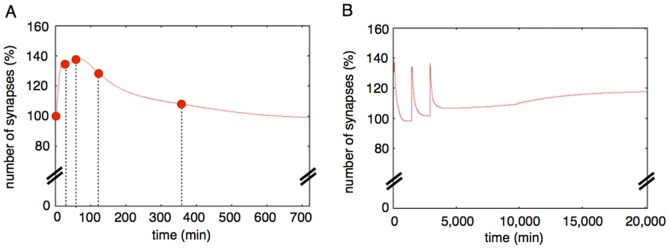
Figure 14. Time-course of simulation results.
A: A simulation result of our mathematical model with a single stimulation. The red dots show time-points when actual experimental values are obtained [20]. The figure shows the effect of single stimuli over 12 hrs (720 min). After an additional 12 hrs (total 24 hrs = 1440 min), the effect of the single stimuli on the relative number of synapses did not change (Figure S1). B: A simulation result of our mathematical model with three times repetitive stimuli. By repeating the stimulus with a 24 hr interval ( = 1440 min) three times, the relative number of synapses was kept at a level 20% higher than the basal synapse number.

