Figure 15.
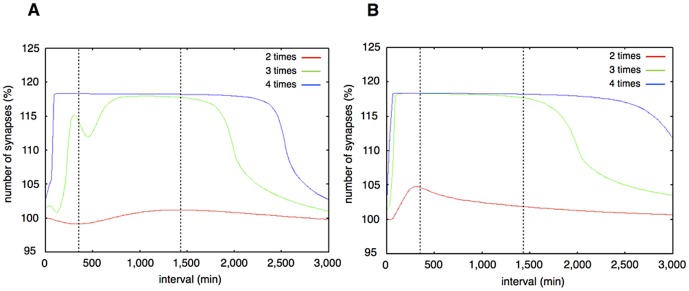
A. Synaptic maintenance responsiveness of our model to the number of stimuli and intervals. The horizontal axis shows the intervals of each stimulation. The vertical axis shows the increase ratio of synapses at two weeks after the first stimulation. The red line shows synaptic maintenance response with two times repetitive stimuli. The green line shows three times repetitive stimuli. The blue line shows four times repetitive stimuli. The two vertical dotted lines show the approximate lower limit and the upper limit of intervals between the three times stimuli for synaptic maintenance in experimental results [20]. B. Synaptic maintenance responsiveness of our model to the number of stimuli and intervals (single step model). The horizontal axis shows the intervals of each stimulation. The vertical axis shows the increase ratio synapses at two weeks after the first stimulation. Red line: two times repetitive stimuli. Green line: three times repetitive stimuli. Blue line: four times stimuli. The two vertical dotted lines show the approximate lower limit and the upper limit of intervals between three times stimuli for synaptic maintenance in experimental results [19]–[21]. This simulation is performed with the single step model. The biggest difference from Figure 15 is the upper limit of intervals which can induce synaptic maintenance.

