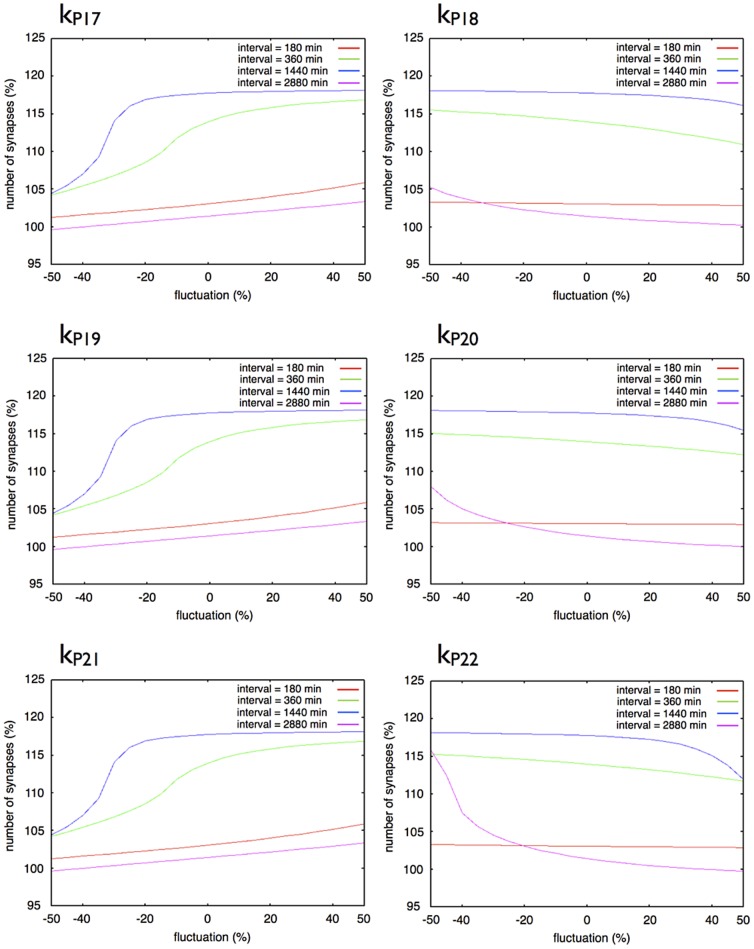
Figure 16. Effect of a change of a single parameter in the three-step model.
Each graph shows the response of synaptic maintenance to a fluctuation in a labeled parameter. The horizontal axes in each graph show a ratio of fluctuation in a labeled parameter. The vertical axes in each graph show the relative number of synapse at 14 days after the first stimulation. The line color indicates the length of intervals between each stimulation: Red: 180 min; Green: 360 min; Blue: 1440 min; and Purple: 2880 min.

