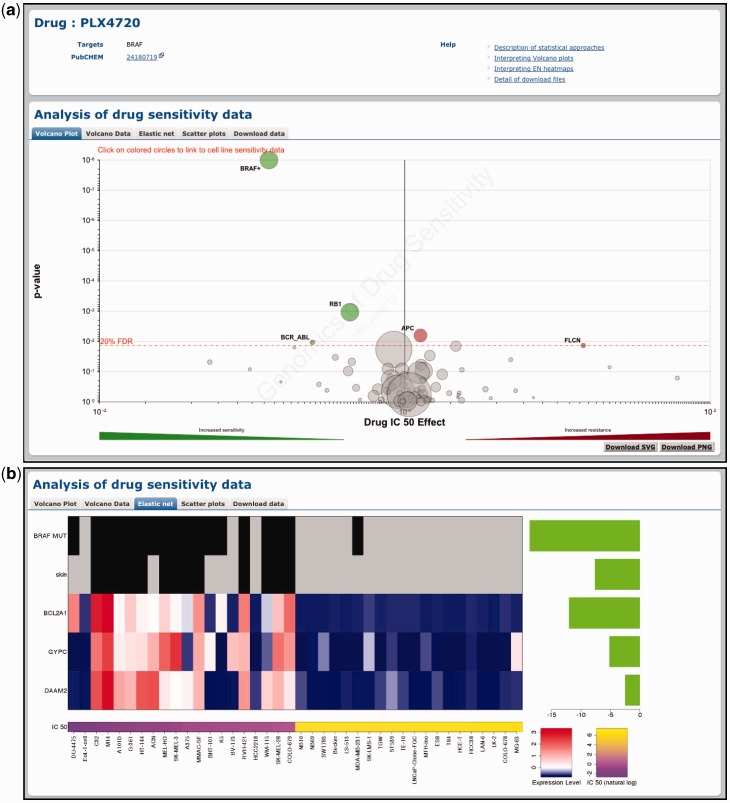
Figure 2.
Querying the GDSC database by compound name. Drug-specific pages demonstrate the effect of genomic features on cell line sensitivity to a particular drug. In this example, we show the effect of genomic features on sensitivity to the BRAF-inhibitor PLX4720. (a) A volcano plot representation of MANOVA results showing the magnitude (x-axis) and significance (P-value, log scale on inverted axis) for each cancer gene association. Each circle represents a single drug–gene interaction and the size is proportional to the number of mutant cell lines screened for each drug. For clarity, the y-axis is capped at P = 1 × 10⁻⁸ and a plus sign (+) next to a circle indicates that the P-value is smaller than this threshold. The dashed red line represents a Benjamini–Hochberg multiple testing correction for significance and only significant associations are coloured either green for drug sensitivity or red for resistance. (b) Elastic net analysis of genomic features associated with sensitivity to PLX4720. Features with negative effect size are associated with drug sensitivity and features with positive effect size are associated with drug resistance (all features are negative in this example). Mutation and tissue features are at the top of the heatmap to represent the presence (black) or absence (grey) of a mutation/tissue subtype. Below this are gene expression and copy number features with blue corresponding to lower expression or copy number, and red to indicate higher expression or copy number.

