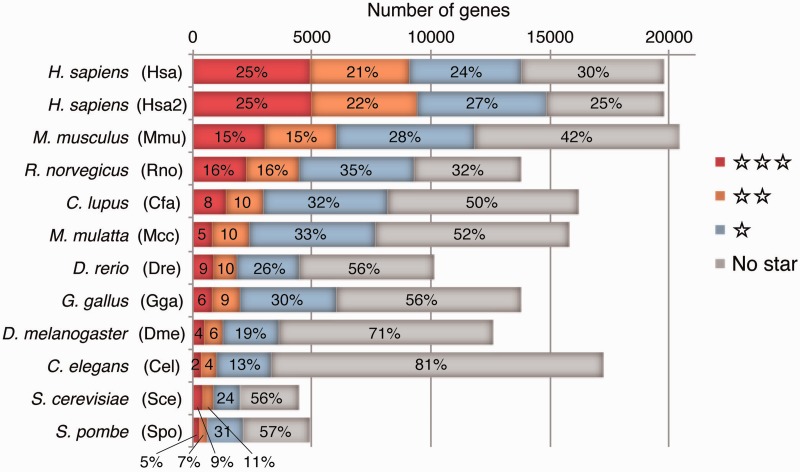
Figure 3.
Number of genes for each reliability level. Reliability levels are represented as stars, where no star is the lowest and a triple star is the highest reliability. Numbers in the bars indicate the percentage of each reliability level in each species, where the numbers with no star include genes without any orthlogous genes in other species.

