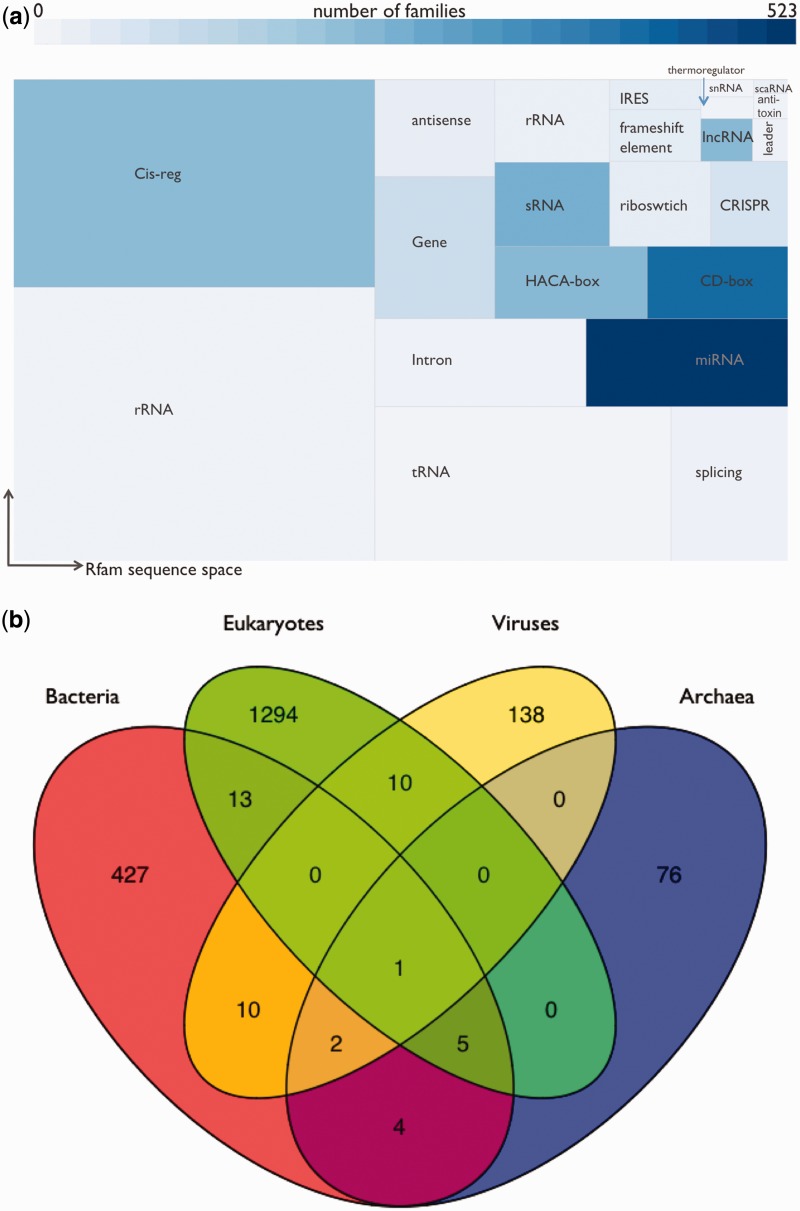
Figure 2.
(a) Rfam types organized according to their coverage of sequence space. Size of rectangles is proportional to the number of regions annotated by families of that Rfam type; colour of rectangles is proportional to the number of families of that type. (b) Taxonomic coverage of Rfam families. Families have been categorized according to the taxonomic groups covered by the seed sequences, and families in clans are treated as belonging to a single family. This analysis omits six families where the seed contains only unclassified sequences.

