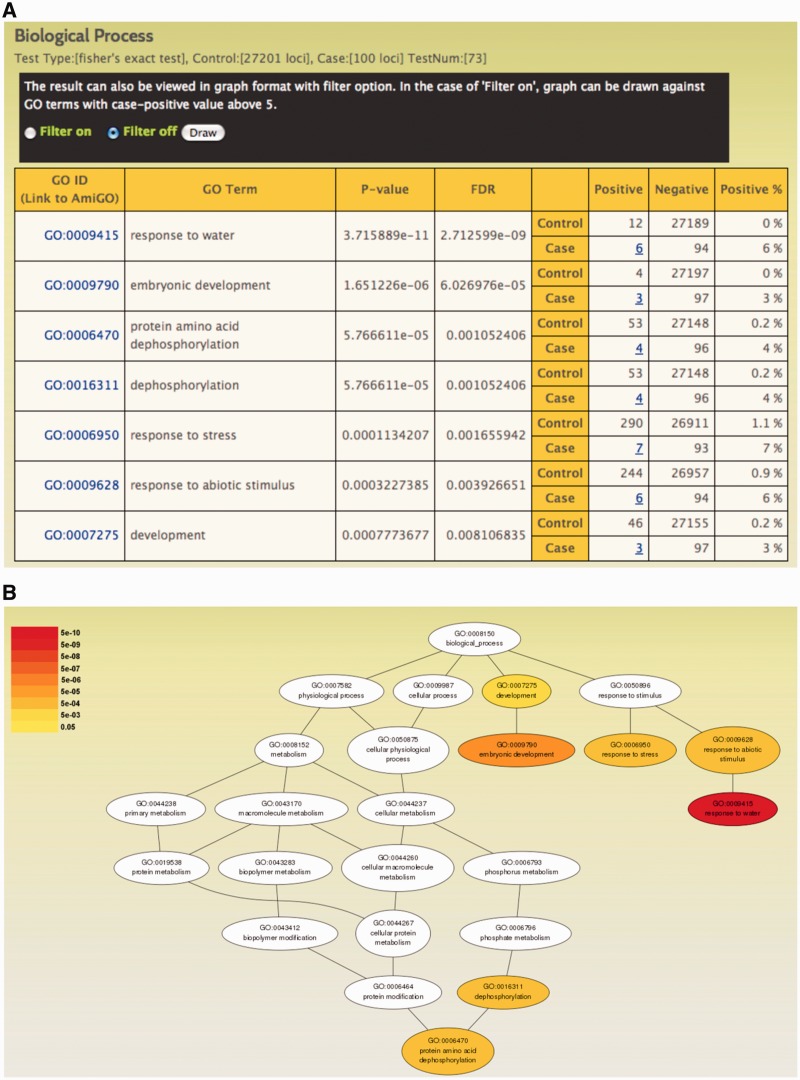
Figure 3.
GO enrichment test results interfaces. (A) A tabular list of over-represented GO terms (false discovery rate, FDR < 0.05) generated by GO enrichment test against the top 100 genes coexpressed with LEA3-1. (B) The over-represented terms can be visualized in a graphical format with the enriched GO terms (FDR < 0.05) shown in color scale corresponding to the FDR value. The graph was constructed with filter off setting.

