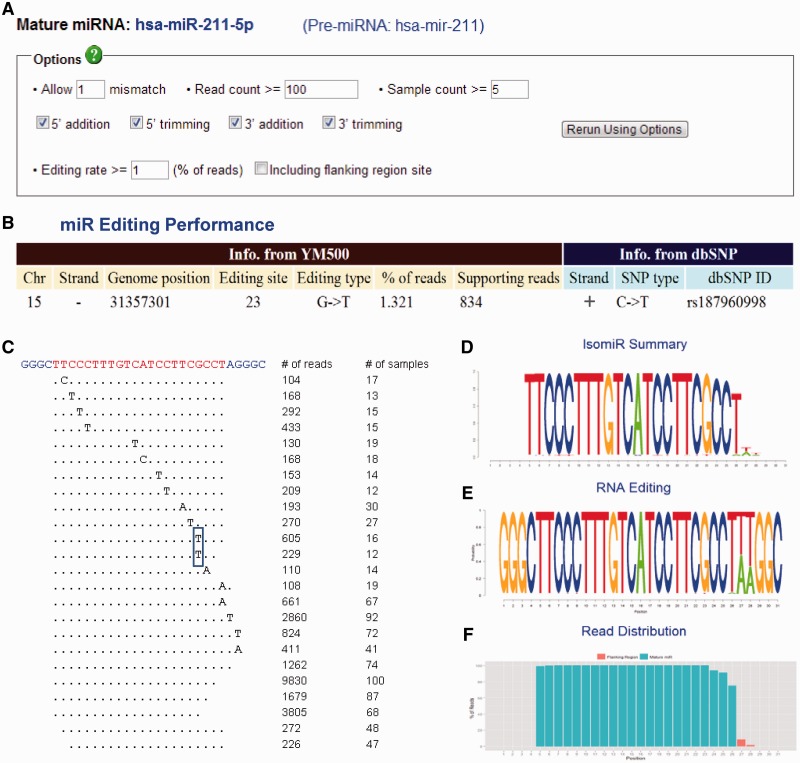
Figure 4.
IsomiR summarization. (A) A panel to define the criteria of isomiRs of a mature miRNA (e.g. hsa-miR-211-5p) from the precursor (hsa-mir-211). (B) The information of edited sites determined by the editing rate defined in (A). Editing information is also compared to that in dbSNP (Build 135). (C) The view of deep sequencing reads mapped to the sequence which contains the mature miRNA (hsa-miR-211-5p) and several flanking bases from the precursor (hsa-mir-211). Each unique isomiR is mapped to the sequence (top), with the mature sequence highlighted (yellow). Numbers on the right show the read count of each unique isomiR and the number of samples in which the isomiR was found. The rectangle indicates the putative editing site in (B). (D–E) The summary information for all isomiRs of a specific mature miRNA is illustrated in a sequence logo format. The number of the y-axis corresponds to the order of the sequencing on the top of (C). The height of each character is proportional to the total read counts (D) or to the read counts in each base (E) of the mature miRNA (hsa-miR-211-5p). (F) The density plot of reads mapping to the sequence on the top of (C). The red and green bars indicate the flanking and the mature miRNA regions, respectively.

