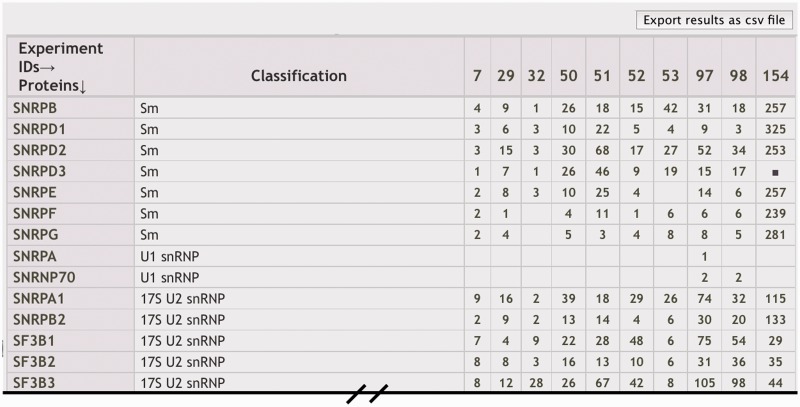
Figure 4.
Comparison of MS experiment results. Generated with the ‘Mass Spec Comparison’ tool, columns in the comparison table display results of individual MS experiments, typically shown as the number of unique peptides used to identify the proteins represented in the different rows. Descriptions for each MS ‘Experiment ID’ are displayed in a legend and linked to individual experiment results.

