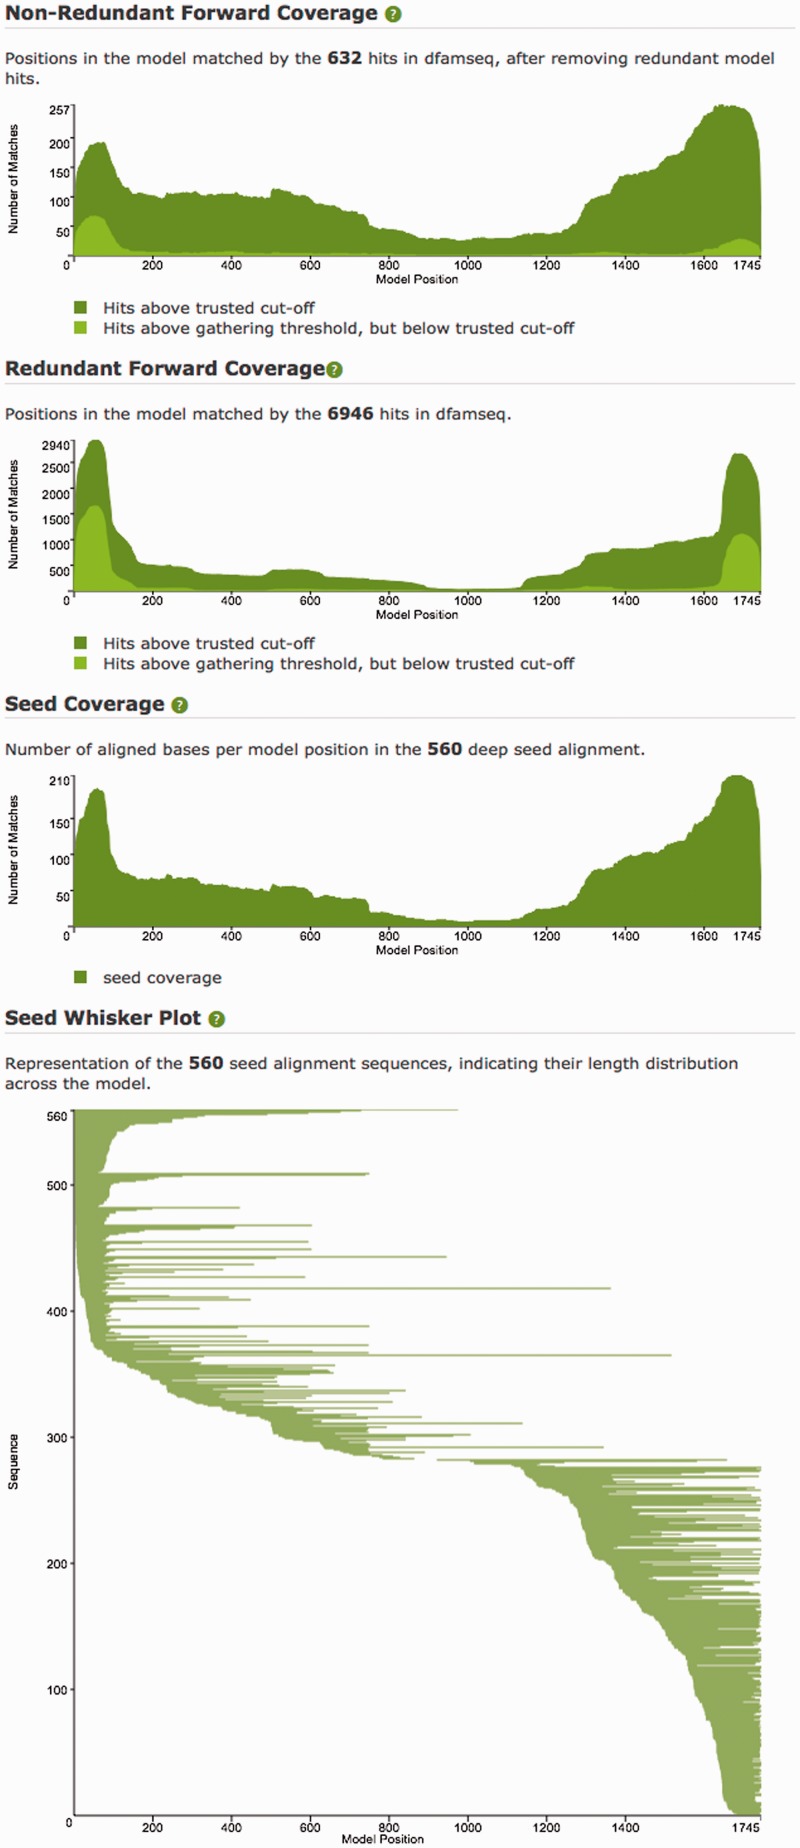
Figure 5.
Plots from the Dfam model page for Kanga1 (DF0000218). The Seed Coverage and Whisker plots show that this seed alignment is made of mostly relatively short fragments, and that the middle section of the model is spanned by only a few instances. The Forward Coverage plot shows a common signal for DNA transposons, with the interior portion of the model covered by fewer instances than the termini, as non-autonomous TEs can suffer various degrees of internal deletion, yet must retain critical terminal features. Many of the 5′ terminal hits fall between the gathering threshold E-value of 15 and trusted cut-off E-value of 0.0002, leading to a terminal light green bulge on the left side of the Non-Redundant Forward coverage plot.

