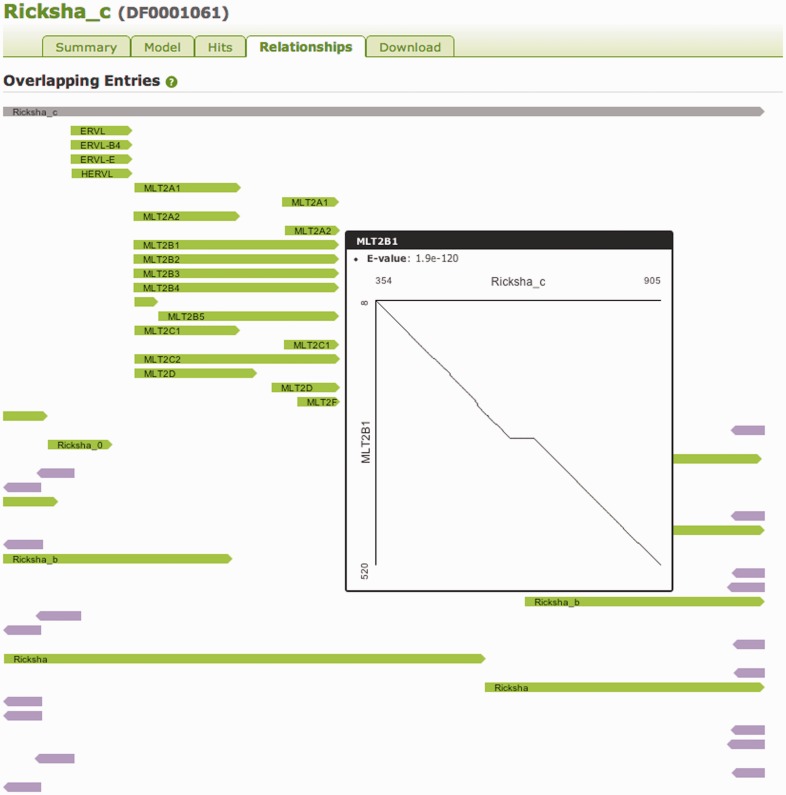
Figure 7.
The Relationship tab for the Ricksha_c (DF0001061) entry. Consensus sequences were produced for all models using the HMMER3 tool hmmemit. These sequences were then searched with all models using nhmmer, with a hit with E-value better than 1e-5 supporting a relationship. Simple glyphs are used to represent the location of different TEs along the along the model, indicating orientation by shape and colour. In this case, the relationships to the ERVL and MLT2 subcomponent elements are represented, as are relationships to other Ricksha models. Placing the mouse over one such glyph raises a dot plot (12) that shows how these elements align to each other.

