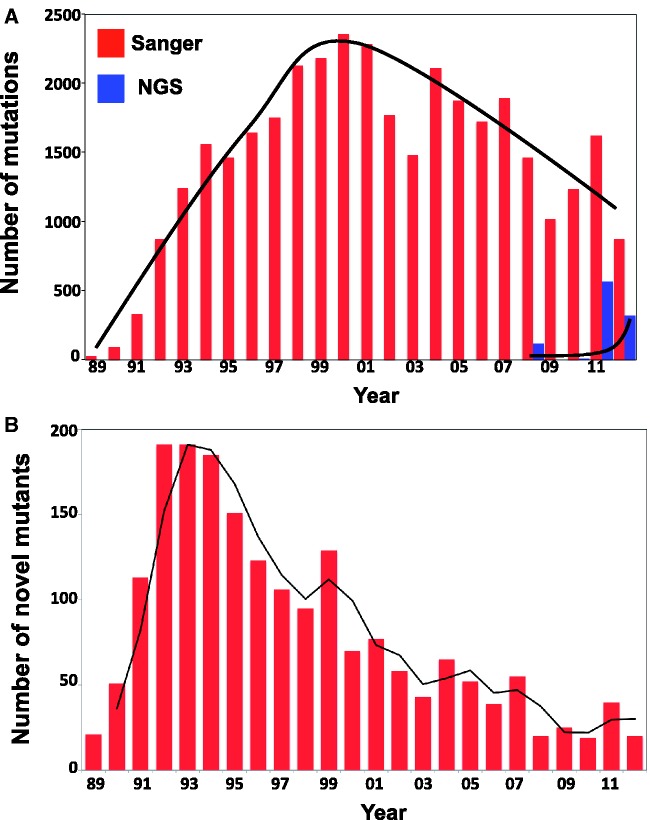
Figure 1.
Trends in TP53 mutation publications. (A) Number of mutations published each year using either Sanger methodology (Red) or NGS (blue). For 2012 (last column on the left), only the first 6 months of the year were taken into account. Only publications describing molecular analysis of TP53 mutations were included in this analysis. (B) Number of novel TP53 mutants described each year since the first discovery.

