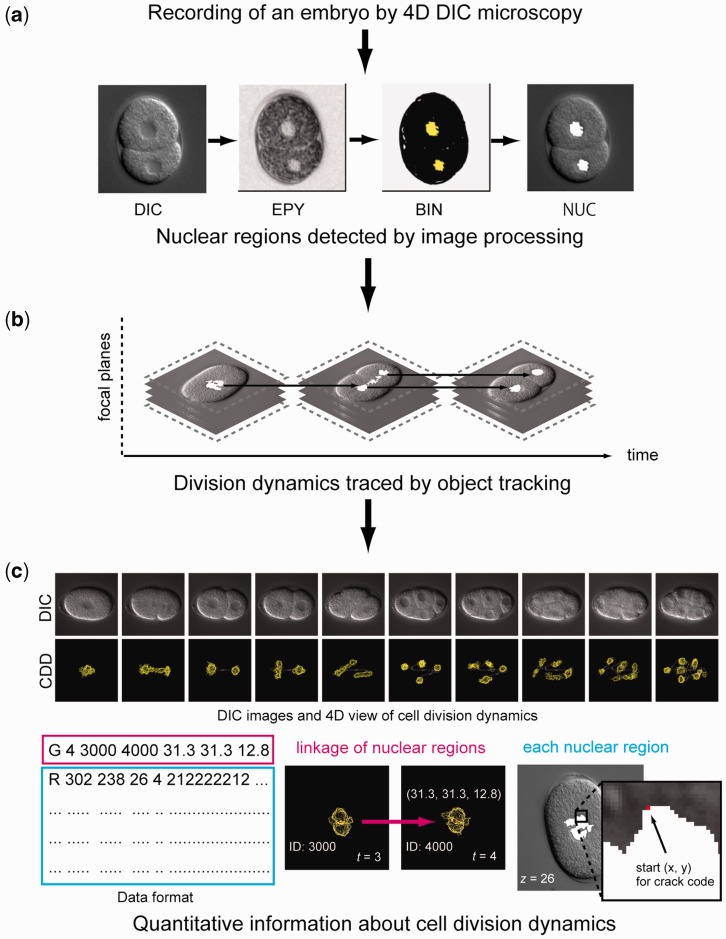
Figure 1.
Overview of our computational method for obtaining quantitative information about cell division dynamics. (a) Use of computer image processing to detect nuclear regions (white) in a DIC microscopy image. DIC, DIC microscopy image; EPY, local image entropy; BIN, low-entropy regions designated by binary thresholding, NUC, detected nuclear regions. (b) Use of object tracking algorithm to obtain division dynamics of detected nuclear regions. (c) Example of DIC microscopy images and quantitative information about cell division dynamics (top). DIC, DIC microscopy images; CDD, 4D view of quantitative information about cell division dynamics. Example of a data file (bottom). Data format of the file (left). The first character of each line, ‘G’ or ‘R’, indicates that the line contains information about nuclear tracking or information about the outline of the nuclear region. The numbers following the index ‘G’ represent time point, identification number (ID) of the ancestor of the nucleus at previous time point, unique ID of the nucleus and xyz positions of the centroid of the nucleus relative to the upper-left corner of the image and the top focal plane, where x and y positions are represented by converting 1 pixel to 0.105 µm (middle). The numbers following ‘R’ represent the start pixel point of the crack code relative to the upper-left corner of the image, focal plane, time point and the crack code that represents the outline of the nuclear region (right). Details of the data format are available at http://so.qbic.riken.jp/wddd/.

