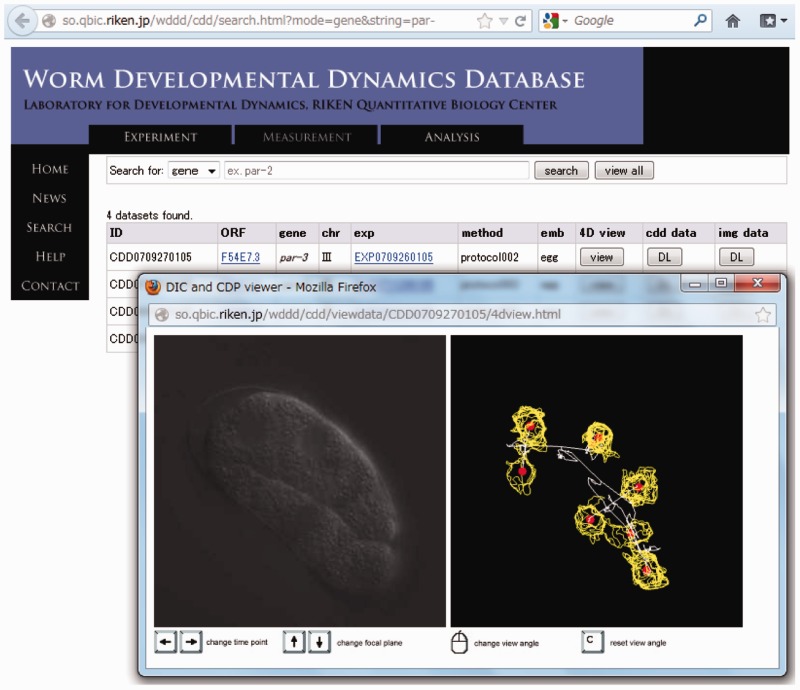
Figure 3.
Viewing 4D DIC microscopy images and quantitative information about cell division dynamics in a web browser. In this example, four datasets for par genes were found in the WDDD and viewed interactively through a web browser. The time point and focal plane could be changed by using the keyboard, and the view angle could be changed by using the mouse. The left and right panel in the viewer window show the DIC microscopy image and quantitative information about cell division dynamics, respectively. Yellow lines represent outlines of detected nuclear regions, and red points represent centroids of nuclear regions corresponding to each nucleus.

