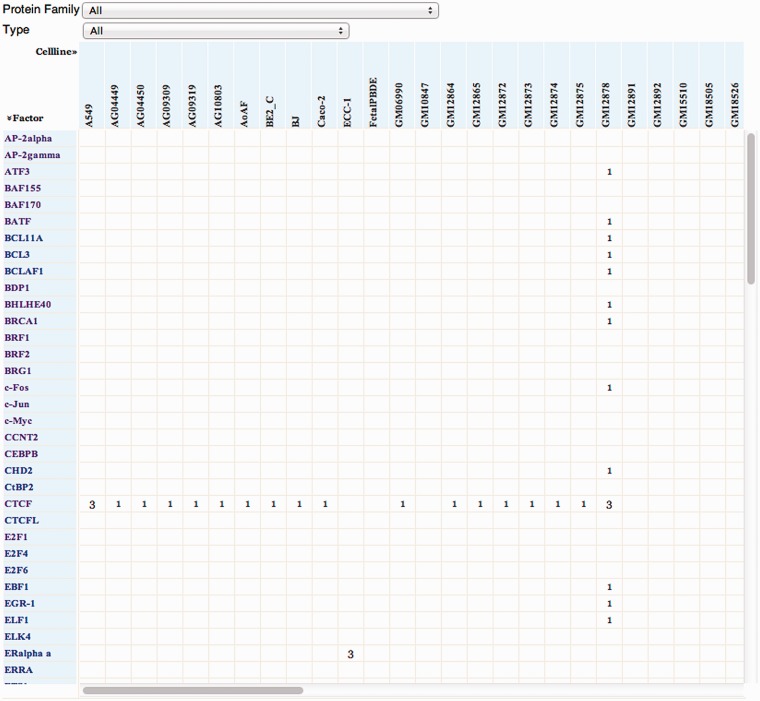
Figure 1.
The matrix on the factorbook home page. The user can click on a specific TF and go directly to its page, or specify a protein family to display its TF members. Each number in the matrix represents the number of ChIP-seq experiments (and resultant ENCODE datasets) performed for that factor in a given cell line.

