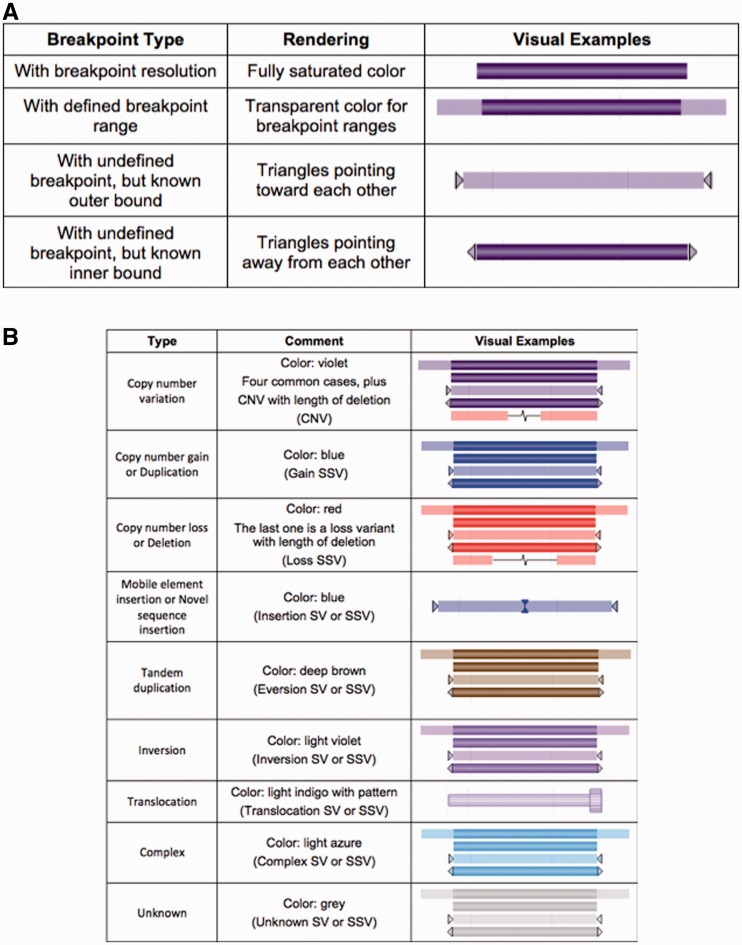
Figure 3.
Rendering of breakpoint ambiguity (A) is shown. Variants with breakpoint resolution are shown with fully saturated color. Breakpoints defining by a range (using inner/outer starts and stops) are shown as fully saturated for the high confidence intervals (the regions defined by the inner start-stop) while the region of breakpoint ambiguity is shown as transparent. In many cases, an undefined breakpoint is submitted, but no likelihood range is provided; in these cases triangles pointing towards each other (when only outer coordinates are provided) or pointing out (when inner coordinates are provided). Rendering call and region type (B) is usually designated by color. SV corresponds to variant region and SSV corresponds to variant calls.

