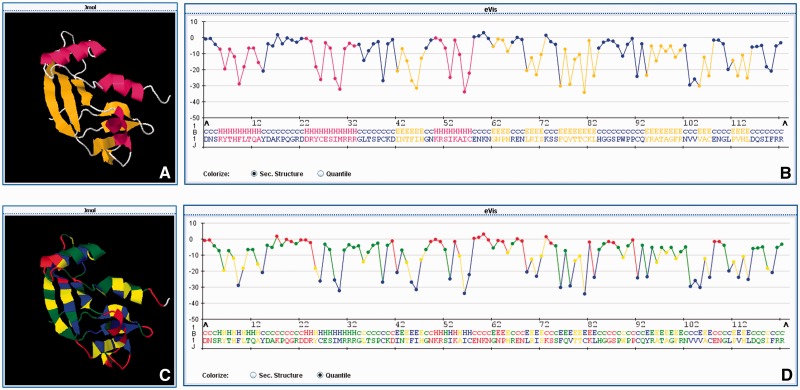
Figure 1.
In this figure, the eProS output of the human angiogenin variant H13A (PDB ID 1b1j) is depicted. In (B) and (D), the energy profile is shown as a sequence of energy values. Colouring schemes for energy-to-structure mappings (C and D) and structure-to-sequence mappings (A and B) are provided. The energy colouring is discretized by assigning each energy value to one of the 4-quantiles in the energetic spectrum derived from the eProS database. This measure is because of visualization and performance purposes. The colour mappings provide insights that can contribute to identify low-energetic and, thus, stabilizing regions and properties in protein structures.

