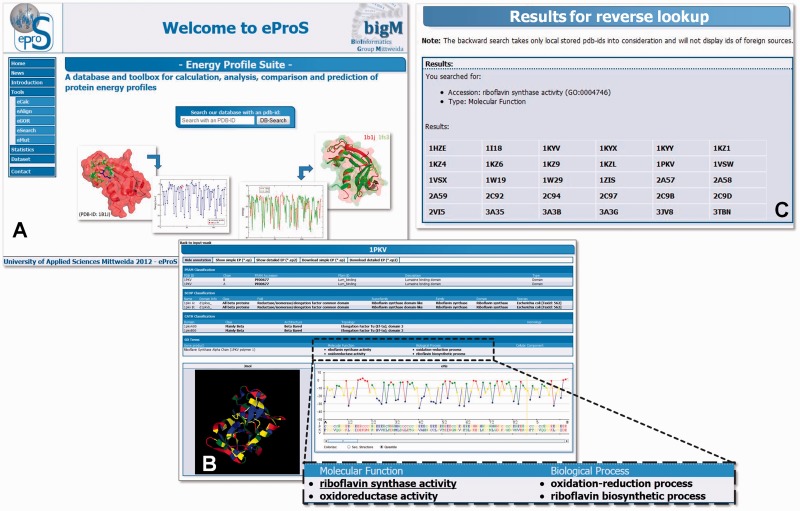
Figure 3.
The eProS database can be accessed through the eProS homepage (A) by specifying a PDB ID, by browsing the data set (‘Dataset’ link, on the left in A) or by using the eCalc tool of the eProS toolbox (see list in A on the left). The graphical output of energy profile data given by eProS (B) includes visualizations by graphs and a 3D structure viewer. Annotations related to foreign databases (Figure 2) are reported, and they provide a wide spectrum of information about structural and functional aspects of the protein of interest (shown in B). Additionally, annotations can be accessed interactively. By that, the integrated reverse annotation lookup lists all PDB IDs that match the specified annotation and that are currently present at the database (C). From this, the listed protein structures can be investigated concerning common energetic properties that point to their structural and functional similarity.

