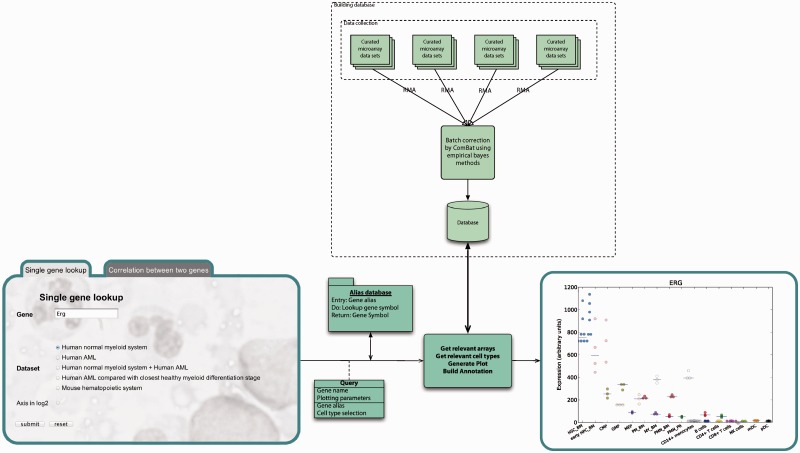
Figure 2.
Diagram of database construction and output from query. Top-down: The database is build from publicly available data, normalized by RMA and batch corrected by ComBat (11). Right-to-left: Queries are sent to gene alias directory, and relevant gene expression data are retrieved from the repository. Plot is generated from gene expression data together with figure text and list of abbreviations used in the plot and formatted in to a result page.

