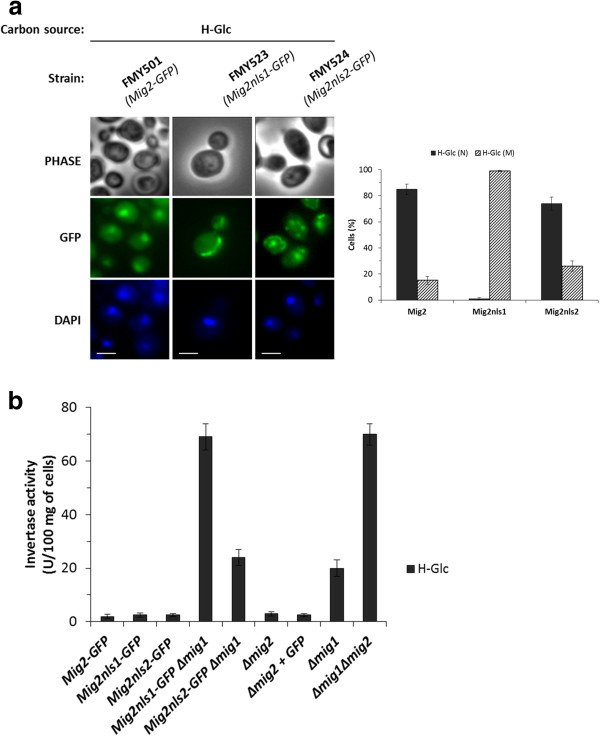
Figure 3.
Identification of Mig2 NLSs. (a) The FMY501 (Mig2-GFP), FMY523 (Mig2nls1-GFP) and FMY524 (Mig2nls2-GFP) were grown in YEPD high-glucose medium (H-Glc) until an A600nm of 1.0 was reached and then transferred to YEPGly low glucose medium (L-Glc) for 5 min. The cells were visualized by fluorescence microscopy, DAPI staining revealed nuclear DNA. Scale bar is 10 μm. The nuclear localization of fluorescent reporter proteins was determined in at least 100 cells in three independent experiments. Means and standard deviations are shown for at least three independent experiments. N denotes a nuclear fluorescence signal and M mitochondrial fluorescence signal. (b) The FMY501 (Mig2-GFP), FMY523 (Mig2nls1-GFP), FMY524 (Mig2nls2-GFP), FMY525 (Mig2nls1-GFP Δmig1), FMY526 (Mig2nls2-GFP Δmig1), Y14575 (Δmig2), FMY536 (Δmig2 + GFP), H174 (Δmig1) and MAP24 (Δmig1 Δmig2) strains were grown in YEPD high-glucose medium (H-Glc) until an A600nm of 0.8 was reached. Invertase activity was assayed in whole cells. Values are the averages of results obtained in four independent experiments.

