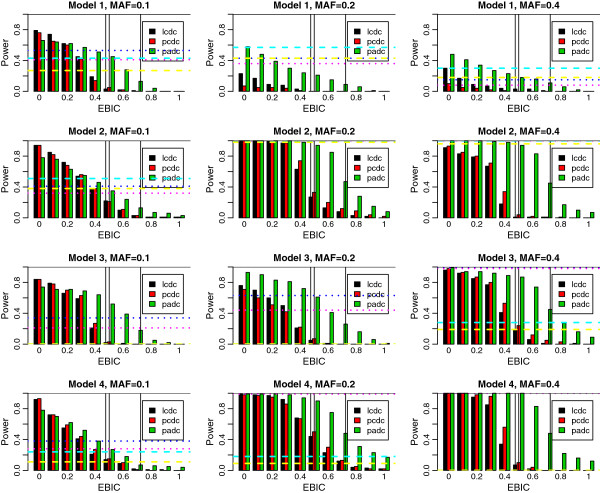
Figure 2.
Power simulation for scenarios 1–12 in 800/800 case–control data with LCDC, PCDC, and PADC. The dotted horizontal lines show power resulted from BOOST with significance levels 5% (pink) and 30% (blue). Three vertical lines emphasize LCDC and PCDC at γ = 0.5 and PADC at γ = 0.7, respectively.

