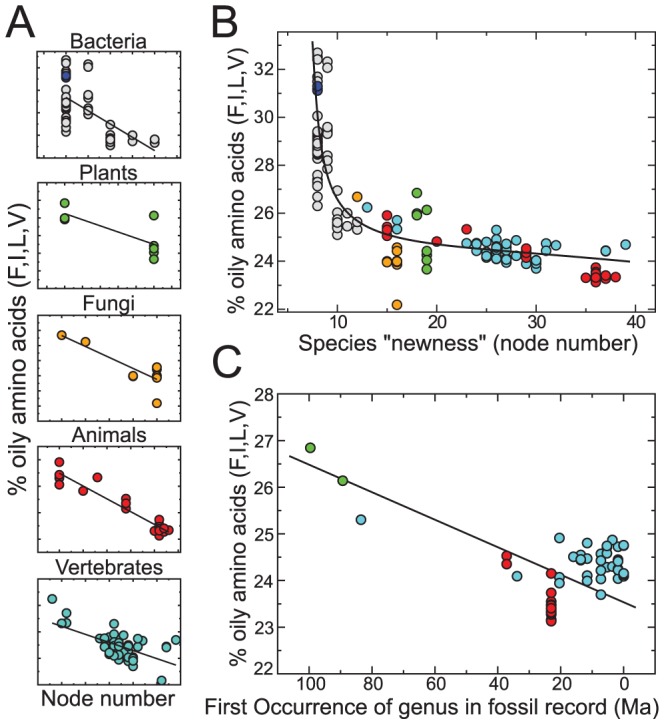
Figure 2. Proteome oil content reduces over “evolutionary time”.

Proteome databases, both individually (A; detailed in Figure S1 in Text S1) and cumulatively (B; number of data points,  ), indicate a steady reduction in proteome oil content (%FILV) over evolutionary time (organism node number), with a Spearman rank correlation coefficient
  and probability
  . Another metric for evolutionary age (paleobiology's “First Occurrence” records; C) reiterates this trend (Spearman
  ,
,  ,
,  ; improved to
  ,
,  when binned per the abscissa), indicating the existence of a “super-oily” predecessor to all that exists. The three archeal proteomes obtained from Ensembl Bacteria are denoted by the blue-filled circles in (A, top) and (B).
