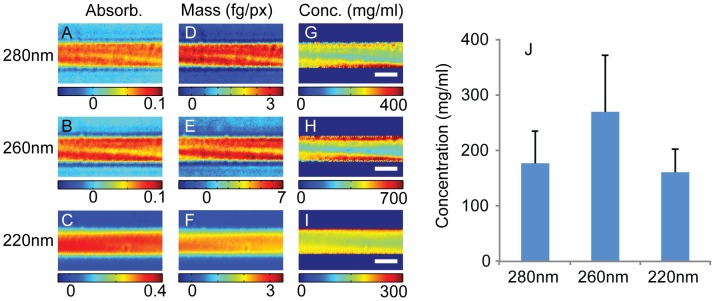
Figure 1. Deep ultraviolet transmission imaging of fibronectin fibers.
Fn fibers (n = 8) were imaged in a deep ultraviolet transmission microscope at wavelengths 280 nm, 260 nm, and 220 nm. Panels A–C show optical density maps of the same Fn fiber at 280 nm (A), 260 nm (B), and 220 nm (C). These optical density maps were converted to maps of mass (D–F) using extinction coefficients calculated from the amino acid sequence of fibronectin (Uniprot P02751-9) and maps of concentration (G–I) by assuming the fibers have a cylindrical cross section to find the path length (scale bar 2 µm). Fn concentrations were averaged over a region in the center of the fiber to avoid edge effects due to errors in the assumed circular cross sectional profile. The resulting measurements of fibronectin concentration are shown in panel J, the error bars show one standard deviation. The Fn concentrations were 177±59 mg/ml, 270±102 mg/ml, and 160±42 mg/ml (mean ± SD) measured at 280 nm, 260 nm, and 220 nm respectively.

