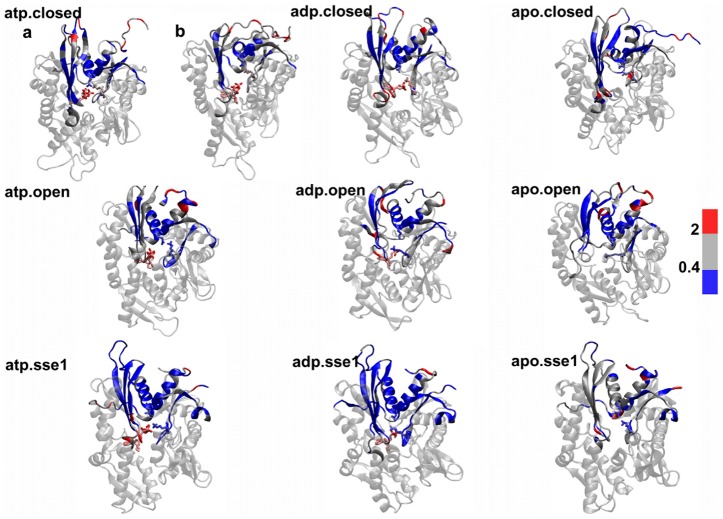
Figure 3. Nucleotide binding site.
Most representative conformations of the ATP-binding site obtained by clustering on nucleotide binding site. The binding site residues, as well as loop 210 and the C-terminal helix and linker (residues 370–390) are color-coded according to the average local flexibility calculated over the MD trajectories: blue, local flexibility below 0.4 Å2; red, local flexibility above 2 Å2. For the ATP bound closed DnaK complex, two representative conformations are shown, namely the most populated one (a) and the alternative one showing loop 210 folding towards the linker (b), see main text for further details.

