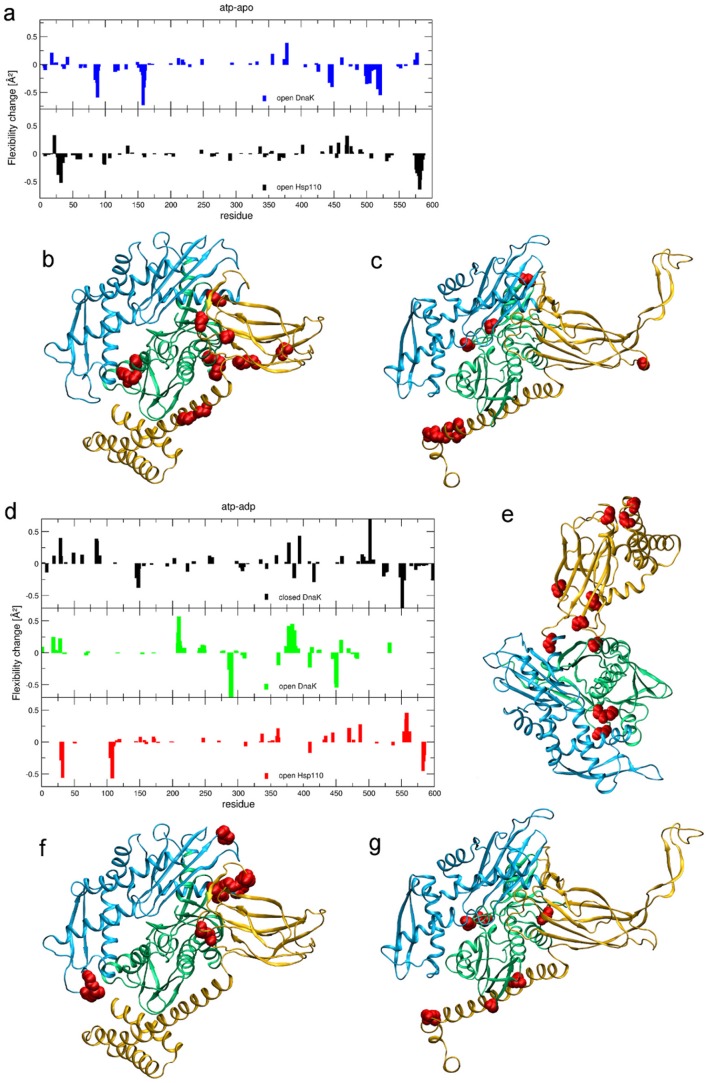
Figure 5. Average flexibility modulation.
a) Histogram showing change in local flexibility of each residue going from the apo to the ATP bound state. Differences within statistical error are not considered. Top: open DnaK. Bottom: Sse1. b)–c) Flexibility change peaks in DnaK (b) and Sse1 (c) reported as spheres on the 3D structure. d) Histogram showing change in local flexibility of each residue going from the ADP to the ATP bound state. Differences within statistical error are not considered. Top: closed DnaK; middle: open DnaK; bottom: Sse1. e)–f)–g) Flexibility change peaks in closed DnaK (e), open DnaK (f) and Sse1 (g) reported as spheres on the 3D structure.

