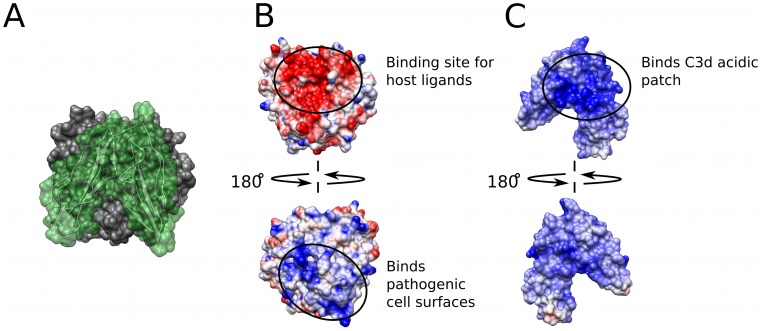
Figure 1. Molecular representations of the C3d-CR2 interaction.
(A) Surface representation of the C3d-CR2 interaction with C3d in gray and CR2 in green (PDB Code: 3OED). (B) Electrostatic potential surface projection for C3d (PDB Code: 1C3D). (C) Electrostatic potential surface projection for CR2 (PDB Code: 1LY2). The code for panels (B) and (C) are as follows: the color transitions from red – white – blue when going from negative (−5 kT/e) – neutral (0 kT/e) – positive (+5 kT/e) electrostatic potential.

