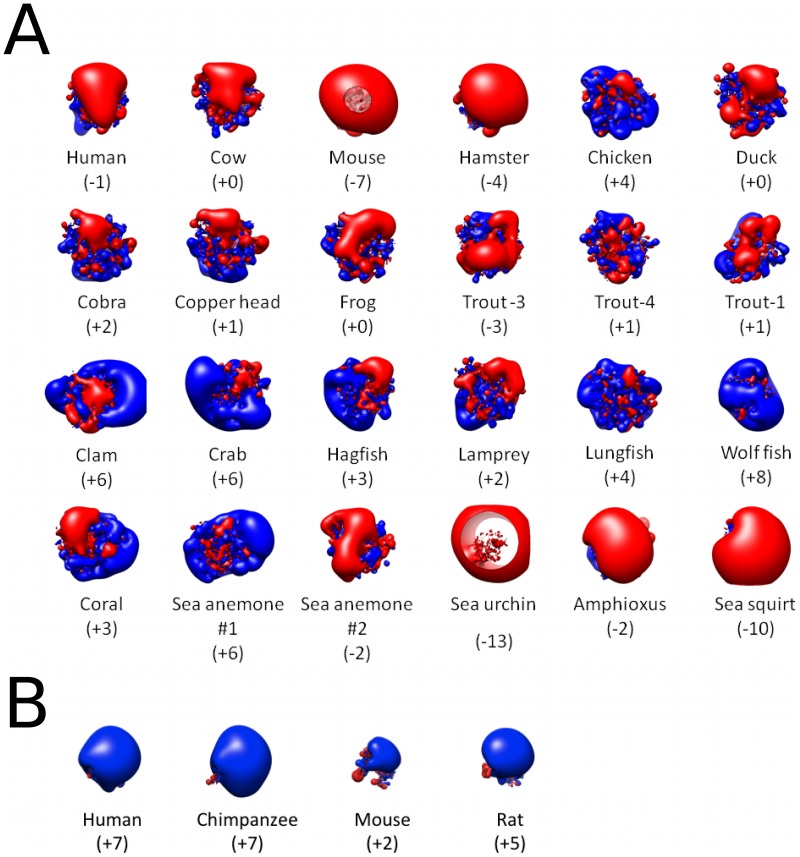
Figure 2. Spatial distributions of electrostatic potential for homologues of C3d and CR2.
(A) Electrostatic potential distributions for 24 homologues of C3d [red, negative (−1.5 kT/e); blue, positive (1.5 kT/e)]. (B) Electrostatic potential distributions for 4 homologues of CR2 [red, negative (−1.5 kT/e); blue, positive (1.5 kT/e)]. The net charge (e) of each homologue is provided in the parentheses.

