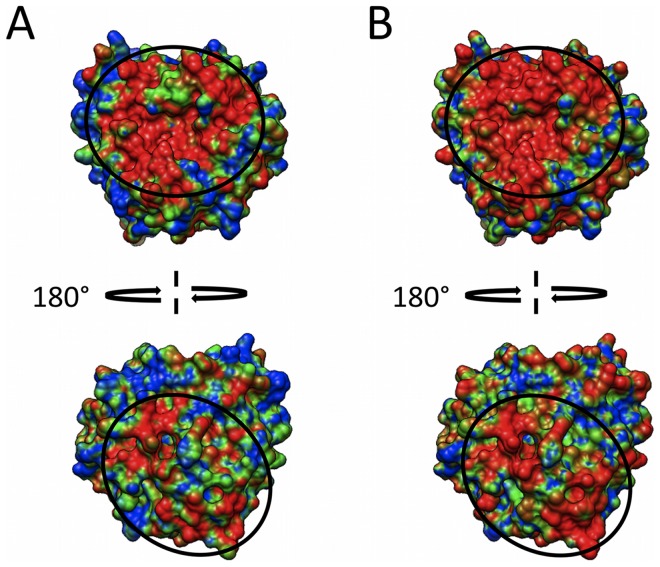
Figure 4. Electrostatic similarity distributions for perturbed human C3d structures.
(A) Perturbation map for a 20 ns explicit-solvent MD simulation, based on 200 snapshots (extracted every 100 ps). (B) Perturbation map based on a theoretical alanine scan, consisting of 64 charged residue to alanine mutations. Color scheme is: blue – green – red; low to high similarity, corresponding to ESI values of 0.5–0.7–0.9.

